

What Is Interval Data? Survey Questions, Examples, and Analysis
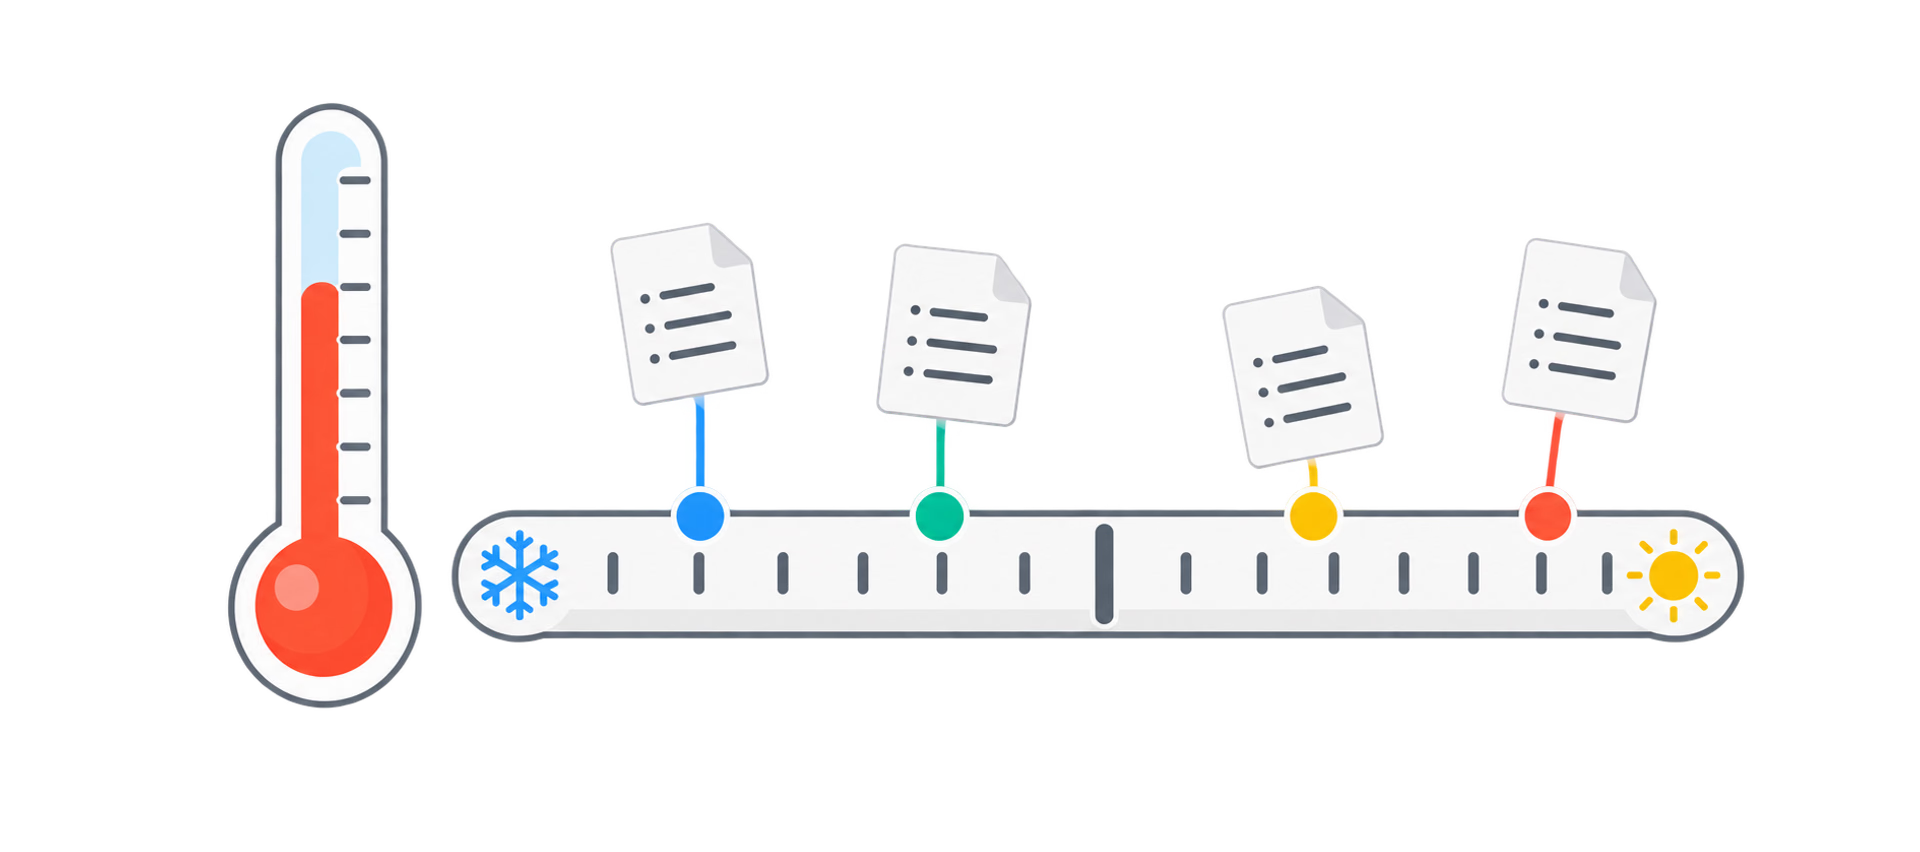
Interval data is quantitative data whose values are ordered and separated by equal, meaningful units, but whose zero point is conventional rather than a true absence. Differences can be interpreted, while ratios cannot: 20°C is 10 degrees warmer than 10°C, but it is not meaningfully “twice as hot.” Temperature in Celsius or Fahrenheit and calendar years are familiar examples.
Interval-scale variables are less common in direct survey questions than ordinal ratings or ratio counts, amounts, and durations. A numbered response is not automatically interval data. Correctly identifying the scale helps you avoid invalid percentage-change or “twice as much” comparisons between raw values and choose summaries that match what the values mean. For the complete process around cleaning, segmenting, interpreting, and reporting responses, begin with our survey results analysis guide.
Characteristics of interval data
- The values are quantitative and ordered. A higher value represents a higher point on the measured scale.
- Differences are measured in equal units. A five-degree change has the same size at every point on a Celsius scale.
- Zero is a reference point, not an absence. Zero degrees Celsius is a temperature; it does not mean that temperature is missing or does not exist.
- Differences and averages are meaningful. You can compare changes, distances between values, means, and standard deviations in the scale’s unit. A raw sum still needs a meaningful context.
- Ratios of raw values are not meaningful. Twenty degrees Celsius is not twice as warm as ten degrees Celsius. Percent changes from an arbitrary zero can also mislead.
- Zero and negative values may be valid. A Celsius temperature can be zero or below zero. Negative values are possible on some interval scales, but they do not define the data type.
| What it identifies | A position on a quantitative scale with equal units |
|---|---|
| Value order | Meaningful |
| Distance between values | Equal and meaningful |
| True zero | No; zero is conventional rather than a complete absence |
| Meaningful operations | Differences, means, variance, standard deviation, and correlation |
| Generally invalid interpretations | Raw-value ratios, “twice as much,” and coefficient of variation |
| Useful charts | Histogram, dot plot, box plot, line chart, or scatter plot |
Interval-scale survey question examples
Genuine interval questions ask for a point on an established equal-unit scale. Survey datasets can also contain interval variables imported from an instrument, calendar, or validated scoring system. The examples and lookalikes below show why the meaning of the scale matters more than its appearance.
Interval-data examples and common nonexamples
Thermostat temperature Interval
Thermostat temperature
1 of 9- Question or value
- What temperature, in °C, did the thermostat display when you completed this survey?
- Classification
- Interval
- Reason or caution
- Degree differences are equal; 0°C is a conventional reference rather than no temperature.
Calendar year Interval
Calendar year
2 of 9- Question or value
- In which calendar year did your organization first use this service?
- Classification
- Interval
- Reason or caution
- Year differences are meaningful, while the calendar origin is conventional.
Subscription date Interval when encoded as dates
Subscription date
3 of 9- Question or value
- On which calendar date did your subscription begin?
- Classification
- Interval when encoded as dates
- Reason or caution
- Analyze differences with date-aware software and a consistent calendar and time zone.
Appointment time Interval-like but circular
Appointment time
4 of 9- Question or value
- At what time of day did your appointment begin?
- Classification
- Interval-like but circular
- Reason or caution
- Clock units are equal, but the scale wraps at midnight and needs time-aware analysis.
Standardized score Possibly approximately interval
Standardized score
5 of 9- Question or value
- What was your score on the named standardized assessment?
- Classification
- Possibly approximately interval
- Reason or caution
- Use interval methods only when the instrument’s scoring and validation support equal differences.
Age in years Ratio
Age in years
6 of 9- Question or value
- Age measured as elapsed time in years
- Classification
- Ratio
- Reason or caution
- Age is elapsed time with a meaningful zero.
Age group Ordinal
Age group
7 of 9- Question or value
- Which age group includes you: 18–24, 25–34, 35–44, or 45+?
- Classification
- Ordinal
- Reason or caution
- The collected answers are ordered categories, not exact ages.
Satisfaction 1–5 Ordinarily ordinal
Satisfaction 1–5
8 of 9- Question or value
- Rate your satisfaction from 1 to 5.
- Classification
- Ordinarily ordinal
- Reason or caution
- Equal visual spacing does not prove equal differences in the underlying attitude.
Customer ID Nominal
Customer ID
9 of 9- Question or value
- Customer ID 10482
- Classification
- Nominal
- Reason or caution
- The digits identify a customer; their numerical differences have no measurement meaning.
Temperature in kelvins is ratio data because its scale begins at absolute zero. Categories such as cold, warm, and hot are ordinal data because they have an order without measured equal differences.
How to design and code interval-data questions
- Confirm that equal differences are defensible. Numbers placed at equal visual distances do not prove equal measurement intervals.
- Name the scale, unit, and reference. Specify °C or °F, the calendar and time zone, or the exact standardized instrument and scoring version.
- Ask for only the precision respondents can provide. Whole calendar years may be reliable when exact dates are not. A decimal temperature may be unreasonable without a display.
- Use consistent formats. Standardize date order, time format, units, and decimal rules across respondents and survey waves.
- Keep valid zero separate from missing values. A zero reading can be real. Skipped, unknown, not-applicable, and not-asked answers need different codes.
- Preserve the original value. You can create ranges later for a report. Replacing exact values with groups during collection loses detail that cannot be recovered.
- Follow validated scoring rules. Do not change an assessment’s wording, direction, item set, or missing-answer rules and still assume its scores retain the same interpretation.
- Pretest unfamiliar questions. Check that respondents understand the requested unit, can recall the answer, and use the input format as intended.
SurveyLegend’s Number Box can request an exact numerical value. The field type does not decide the measurement level: the construct, unit, and meaning of zero do.
Interval data vs. data grouped into intervals
Interval data describes a measurement scale. A data interval can simply mean a range or bin, such as 10–19 or 20–29. Grouping interval or ratio values into ordered ranges creates ordinal categories and removes exact differences within each range. Equal-width bins can make a histogram easier to read, but they do not create interval-scale measurement. Unequal bins can also be valid when the chart uses their widths and frequency density correctly.
How to analyze interval data step by step
- Verify the measurement. Confirm that order and equal differences are meaningful, while zero remains a conventional point.
- Validate units and formats. Convert Celsius and Fahrenheit readings to one documented unit, parse calendar values correctly, and check time zones or midnight wraparound where relevant.
- Clean without hiding information. Separate missing responses from real zeros, identify impossible values and duplicates, investigate unusual observations, and preserve the raw dataset with a record of every change.
- State the valid base. Report how many people were eligible, how many supplied a usable value, how many were missing, and whether survey weights were applied.
- Inspect the distribution. Review the values and a histogram, dot plot, or box plot before reducing the data to one average.
- Describe center and spread. The mean and standard deviation use equal units. The median, IQR, range, and percentiles can add useful context, especially with skew or unusual values.
- Select a method from the question and design. Groups, repeated responses, sampling, missingness, model form, and residual behavior matter—not only the measurement level.
- Interpret differences rather than raw ratios. Report units, effect sizes, uncertainty, practical meaning, and limitations without calling one raw interval value a percentage or multiple of another.
Worked interval-data analysis example
Imagine that ten respondents read a room thermostat when completing a facilities survey. Their answers are 18, 19, 19, 20, 20, 20, 21, 21, 22, and 30°C. Celsius temperature is interval data because degree differences are equal and 0°C is not a true absence of temperature.
Summary of thermostat readings from 10 respondents
Valid responses 10
Valid responses
1 of 6- Result
- 10
- Interpretation
- All ten readings are included in this example.
Mean 21°C
Mean
2 of 6- Result
- 21°C
- Interpretation
- The sum of the readings divided by ten.
Median 20°C
Median
3 of 6- Result
- 20°C
- Interpretation
- Half the readings are at or below 20°C and half are at or above it.
Q1, Q3, and IQR 19°C, 21°C, and 2°C
Q1, Q3, and IQR
4 of 6- Result
- 19°C, 21°C, and 2°C
- Interpretation
- The middle half of readings spans two degrees.
Minimum, maximum, and range 18°C, 30°C, and 12°C
Minimum, maximum, and range
5 of 6- Result
- 18°C, 30°C, and 12°C
- Interpretation
- The high reading creates a wide total range.
Sample variance and standard deviation 11.33°C² and 3.37°C
Sample variance and standard deviation
6 of 6- Result
- 11.33°C² and 3.37°C
- Interpretation
- Standard deviation expresses spread in the original degree unit.
The 30°C reading pulls the mean above the median and deserves investigation, but it should not be removed automatically. It could be a typing or unit error, or it could reveal a genuine problem in one room. A histogram or dot plot would make the cluster and unusual reading visible. The mean of 21°C converts to 69.8°F, while the standard deviation converts by multiplying by 9/5 to about 6.06°F. The conversion changes the zero point and scale factor but preserves the underlying temperature differences.
You may say that 30°C is 12 degrees warmer than 18°C. You should not say that 30°C is 1.67 times as hot. The coefficient of variation and percentage change from a Celsius or Fahrenheit zero are also generally inappropriate because their results change when the arbitrary origin changes.
Charts and summary statistics for interval data
- Dot plot: preserves individual readings and is especially clear for a smaller sample.
- Histogram: shows center, spread, skew, gaps, and possible outliers. Choose bins that reveal rather than hide the distribution.
- Box plot: summarizes the median and quartiles and helps compare distributions between groups. A point beyond a whisker is a signal to investigate, not proof of an error.
- Line chart: can show measurements across a meaningful time sequence. Account for seasonality, repeated observations, and dependence where relevant.
- Scatter plot: shows the relationship between two numerical variables and can expose non-linearity, clusters, and influential observations before correlation or regression.
Mean and standard deviation are natural interval-scale summaries because both depend on equal differences. Median and IQR can still make a skewed or outlier-prone distribution easier to understand. For clock times near midnight, ordinary arithmetic can fail: the midpoint of 23:55 and 00:05 is midnight, not noon. Use time-aware or circular methods when wraparound matters.
Statistical tests for interval data
Interval data supports many quantitative methods, but the scale alone never selects a test. Start with the research question and study design, then assess independence, group distributions, outliers, repeated measurements, sample size, linearity, residual behavior, and variance assumptions.
Starting points for interval-data analysis
What is typical, and how much do values vary? Mean and SD; median and IQR
What is typical, and how much do values vary?
1 of 8- Possible starting method
- Mean and SD; median and IQR
- Important consideration
- Inspect the full distribution, units, and valid response base.
Do two independent groups differ in their means? Welch’s two-sample t-test
Do two independent groups differ in their means?
2 of 8- Possible starting method
- Welch’s two-sample t-test
- Important consideration
- Check independence, group distributions, unusual values, and practical size.
Did the same respondents or units change? Paired t-test on within-unit differences
Did the same respondents or units change?
3 of 8- Possible starting method
- Paired t-test on within-unit differences
- Important consideration
- Match observations correctly and inspect the distribution of differences.
Do three or more independent groups differ? ANOVA or Welch ANOVA
Do three or more independent groups differ?
4 of 8- Possible starting method
- ANOVA or Welch ANOVA
- Important consideration
- Plan follow-up comparisons and account for multiple testing.
Are two quantitative variables associated? Scatter plot and Pearson correlation
Are two quantitative variables associated?
5 of 8- Possible starting method
- Scatter plot and Pearson correlation
- Important consideration
- Check linearity and influential points; correlation does not prove causation.
Does one or more variable predict an interval outcome? Linear regression
Does one or more variable predict an interval outcome?
6 of 8- Possible starting method
- Linear regression
- Important consideration
- Check model form, residuals, independence, influential values, and unequal variance.
Are observations repeated or clustered? Repeated-measures or mixed model
Are observations repeated or clustered?
7 of 8- Possible starting method
- Repeated-measures or mixed model
- Important consideration
- Ordinary independent-observation methods may understate uncertainty.
Does the sample use weights, clusters, or strata? Design-aware estimates and standard errors
Does the sample use weights, clusters, or strata?
8 of 8- Possible starting method
- Design-aware estimates and standard errors
- Important consideration
- Use methods that represent the actual sampling design.
Rank-based or robust methods may be useful when a planned model is a poor fit, but they are not automatic switches for a failed raw-data normality test. Many model assumptions concern residuals, within-person differences, or conditional distributions. Report effect sizes and confidence intervals where possible; a p-value alone does not establish importance or causation. Involve a statistician when the result will support a high-impact decision or a complex research conclusion.
Interval data vs. ratio and ordinal data
- Interval: Celsius temperature; values have equal differences but no true zero.
- Ratio: elapsed age, duration, distance, count, or spending; equal differences and a true zero make raw-value ratios meaningful.
- Ordinal: a single satisfaction rating or age band; categories are ordered, but equal differences have not been established.
- Nominal: an employee ID or preferred channel; values name categories without a meaningful numerical order.
Exact age is ratio data, a birth year is interval data, and an age band is ordinal data. Calendar time and elapsed time answer different questions, so label the variable and unit clearly rather than classifying it from the digits alone. Continue to the ratio data guide or ordinal data guide for their full analysis workflows.
Likert scales, ratings, and interval assumptions
A response to one Likert-type statement is ordinarily ordinal. “Agree” is more positive than “neutral,” but assigning the codes 1, 2, and 3 does not prove that the attitude changes by an equal amount at each step. The same caution applies to arbitrary 0–10 satisfaction or recommendation ratings: a zero printed on the interface is not evidence of a true zero or equal psychological units.
Researchers sometimes sum or average several related items and model the resulting composite score as approximately interval. That decision needs a planned construct, consistent item direction, defensible scoring, suitable missing-data rules, reliability and validity evidence, and model checks. Averaging unrelated questions does not create interval measurement. Learn more in our Likert scale guide.
Common interval-data mistakes
- Confusing an interval measurement scale with numerical ranges, bins, or confidence intervals.
- Calling exact age, duration, distance, counts, or spending interval data instead of ratio data.
- Calling age or spending bands interval data because the category widths look equal.
- Assuming every Likert, NPS, or numbered rating response has equal psychological spacing.
- Treating an arbitrary zero as missing, or coding a skipped response as a real zero.
- Mixing Celsius and Fahrenheit, date formats, calendars, or time zones without conversion.
- Using raw-value ratios, percent change from an arbitrary zero, or coefficient of variation.
- Averaging clock times without accounting for midnight wraparound.
- Reporting only a mean when the distribution or an unusual value changes the interpretation.
- Deleting outliers automatically instead of investigating their source and influence.
- Selecting a statistical test from the measurement level without checking its assumptions.
- Interpreting association or prediction as proof that one variable caused another.
Analyzing interval data with SurveyLegend
SurveyLegend’s Live Analytics gives you an immediate view of collected responses. For deeper calculations or modelling, you can export survey data to Google Sheets, Excel, or CSV and continue in the tool that matches your analysis plan. Keep the raw values, codebook, units, scoring rules, missing-value decisions, and transformations together so another person can reproduce the result.
More about other data types
Interval data is one of five survey data types covered in this guide collection. Continue with the guides below to identify and analyze the other variables in your survey.
Interval data FAQs
What is interval data?
Interval data is quantitative data whose values are ordered and separated by equal, meaningful units, but whose zero point is conventional rather than a true absence. Differences can be interpreted, while ratios cannot. For example, 20°C is 10 degrees warmer than 10°C, but it is not meaningfully twice as hot.
What is an example of interval data in a survey?
“What temperature, in °C, did the thermostat display when you completed this survey?” can collect interval data. Each degree represents the same temperature difference, but 0°C does not mean an absence of temperature. Calendar dates or years can also produce interval data when their differences are analyzed in consistent time units.
How do you analyze interval data?
First verify the scale, unit, format, missing values, and unusual observations. Then report the valid response count, inspect the distribution, and calculate suitable summaries such as the mean, median, range, interquartile range, variance, or standard deviation. Choose charts and statistical methods from the research question, sampling design, repeated measurements, distribution, and model assumptions.
Which statistical tests can be used for interval data?
Possible starting methods include Welch’s t-test for two independent group means, a paired t-test for matched observations, ANOVA or Welch ANOVA for three or more groups, Pearson correlation for a linear association, and linear regression for a continuous interval outcome. Interval measurement alone does not make a method appropriate; its assumptions and the study design still need to fit.
What is the difference between interval and ratio data?
Both interval and ratio data have ordered values and equal units. Ratio data also has a meaningful true zero, which makes proportional comparisons valid. Celsius temperature is interval data, while thermodynamic temperature in kelvins is ratio data. Calendar year is interval data, while elapsed time is ratio data.
Is age interval or ratio data?
Age measured as elapsed time since birth is ratio data because zero represents no elapsed age and ratios are meaningful. A birth year is interval data because the calendar origin is conventional. Age bands such as 18–24 and 25–34 are ordinal categories because the recorded answers are ordered ranges.
Are Likert scales or 0–10 ratings interval data?
A response to one Likert-type or 0–10 rating item is ordinarily treated as ordinal because equal gaps between the underlying attitudes have not been demonstrated. A validated composite made from several related items may sometimes be modeled as approximately interval, but that requires a defensible scoring plan, validation evidence, missing-data rules, and suitable model checks.
Is interval data the same as data grouped into intervals?
No. Interval data describes a measurement scale with equal, meaningful differences and no true zero. Grouping values into ranges or bins is a separate data-processing choice. Once exact values are replaced by ordered ranges, the recorded groups are ordinarily ordinal and some numerical detail has been lost.
Ready to turn feedback into your superpower?
Start creating better feedback surveys with SurveyLegend, start today!