Predicting the presidential election isn’t always easy, but that doesn’t stop political analysts from trying. Some political analysts use a very scientific election prediction model, while others base their election predictions on political polling or political surveys. In this blog, we’ll look at the difference between the two, sampling bias in political surveys, using image surveys, and how to predict election results.
Create your first political survey, form, or poll now!
Political Polls vs. Political Surveys
What is a Political Poll?
A political poll is used to ask one simple question and does not collect any further data from the poll taker, whereas a political survey asks multiple questions and often collects demographic information and other details.
So, how do you do a political poll? Simply ask one question, such as:
- Who will you be voting for in the next U.S. election?
- John Doe
- Jane Doe
- Other
- Undecided
- Not voting
What is a Political Survey?
A political survey asks a variety of questions. After collecting some basic demographic information (such as age, race, and sex), political survey questions could include:
- Will you be voting in the next U.S. election?
- Yes
- No
- Undecided
- If yes, who will you be voting for?
- John Doe
- Jane Doe
- Other
- If no, why won’t you be voting?
- Don’t like the candidates
- Not registered to vote
- Not legal to vote
- Other
- Why are you voting for this candidate? (select all that apply)
- Experience
- Policies
- Personality
- Other
- Who do you expect to win the election?
- John Doe
- Jane Doe
- Other
Conducting Surveys Before an Election
Today, the majority of political polls are still conducted by telephone. For accurate election forecasting, experts say that a pollster must collect 800 responses. That used to be easy; in 1997, before the widespread use of caller ID, pollsters could expect that they would need to place 2,000-2,500 calls to reach 800 responses. Today, it takes between 7,500-9,000 calls to reach that magic number, greatly increasing costs.
So how did experts arrive at 800, in a country of more than 325 million? According to the Harvard Review, the math works out if the sample is truly random (they’ve spared us the mathematics, and we’re happy to take their word for it!). To achieve randomness, telephone polls use a random-digit-dial system, which is a computer-based system.
Of course, today many Americans now only use cell phones, and federal regulations require that cell phone numbers be dialed manually, not by computer, further increasing the cost of political polling by phone.
Just how much on the decline are telephone polls? According to the 2019 State of the Polls report, there were 532 polls taken in the November 2018 general election; 558 for the 2014 presidential election, and 692 for the 2010 presidential election. So, a slow but steady decline. With telephone polling becoming more difficult and expensive, many pollsters seeking political opinions are turning to online polling. Of course, political surveys online present some challenges too; check out our blog Online Surveys: Advantages and Disadvantages.
Watch Out for Election Survey Sampling Bias
Sampling bias can play a role in any election survey or poll, but can be especially detrimental when it comes to predicting the outcome of an election. Here are a few examples of when an election predictor got it wrong—and why.
Harry S. Truman vs. Thomas E. Dewey, 1948
To predict the winner of this presidential election, a nationwide telephone survey was conducted, and the results heavily favored Dewey—by such a wide margin that a confident Chicago Tribune printed their newspaper with the headline “Dewey Defeats Truman” before the final tally was revealed, resulting in this famous photo of a triumphant Truman, who ultimately won, holding up the paper.
What went wrong? Well, in 1948, only wealthy families could afford to own telephones, and the upper classes heavily favored Dewey; meanwhile, lower- and middle-class families, who didn’t own telephones, backed Truman. The researchers failed to consider that by sampling only by phone, they weren’t getting an accurate sampling of the total population.
Barack Obama vs. Mitt Romney, 2012
After the first debate in which Romney appeared to be the clear winner, pollsters took to the phones to predict a winner. However, due to the perception that the debate was disastrous for their candidate, Democrats didn’t want to talk about politics and were less likely to answer questions.
Republicans, however, were now enthusiastic. They were more willing to answer questions, and as a result, polling shifted toward Romney. Of course, Romney’s support was never increasing, the sampling just had a bias toward him.
Donald Trump vs. Hillary Clinton, 2016
There are many theories as to why pollsters got this one wrong, but one theory with sampling bias—and the culprit seems to be online polling. Younger people and those with a college degree, who tend to lean Democratic, are more likely to use the internet, whereas seniors and those with less schooling, who tend to lean Republican, are less likely to be online.
When conducting online polls and surveys, pollsters were more likely to reach Democratic voters, so a Hillary victory was predicted. However, seniors and those without a college education were not as likely to be included in the samples, causing skewed results and an inaccurate prediction.
Image-Based Election Surveys
One popular method of taking an election poll is by using an image poll. This is especially useful in the early stages of an election when people may not know a candidate by name, but will recognize their photo. As you can see in the mock image survey below, people can choose from multiple candidates. Note that the candidates are presented alphabetically, and that image size and composition are about the same, in order not to introduce survey bias into the poll. Read more about using surveys to vote on images.
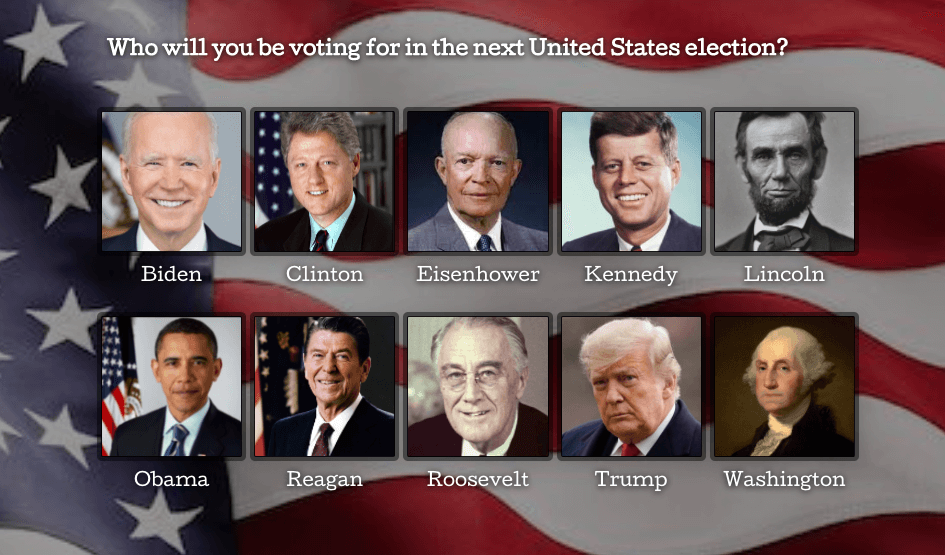 Election Survey created using SurveyLegend
Conclusion
Ready to start making your predictions for the next election? Or maybe you’re interested in conducting an online company election. Either way, you can conduct your election surveys and election prediction polls with SurveyLegend. It’s free to get started and easy to use, and allows you to easily add images to your survey! Plus, since people may be hesitant to share their selection online, SurveyLegend offers online polling security. Check out our recent blog, Online Voting for Elections to learn more about creating a poll and our security processes. Then, get started for free!
Have an election prediction? Let us know who you think is going to come out on top in the next election!
Create your first political survey, form, or poll now!
Frequently Asked Questions (FAQs)
Political polls ask one question, while political surveys ask multiple questions.
Sampling bias occurs when researchers fail to select a fair representation of an entire population. This has resulted in incorrect election predictions, such as the infamous Harry S. Truman vs. Thomas E. Dewey presidential race of 1948.
Online survey platform SurveyLegend offers easy-to-use survey templates to create an election poll or survey. SurveyLegend also allows you to easily create image polls based on candidates.
Voting technology intends to speed the counting of ballots, reduce the cost of paying staff to count votes manually and can provide improved accessibility for disabled voters.
