The Power of Images in Surveys & Polls
Our brains were designed for visual information. Science has proved this time and time again. Just take a look at these powerful image statistics:
- 90% of the information processed by the brain is visual.
- It takes just 13 milliseconds for the human brain to process an image.
- The human brain processes images 60,000 times faster than text.
- 80% of people remember what they see (versus 10% of what they hear and 20% of what they read).
- 95% of buyers said that they wanted shorter and highly visual content.
- Content with visuals grows traffic 12 times faster than content without.
- Images increase brand awareness by 20% and purchase consideration by 40%.
Using clear images enhances clarity and helps customers better understand and respond to surveys.
This data shows why it’s so important to use visuals – but you have to be sure to use them the right way. Making surveys interesting and fun with visuals can further boost engagement and improve the quality of data you collect from your customers. Let’s look at some mistakes to avoid with image-based surveys.
Understanding the Difference Between Online Surveys and Image-Based Surveys
When it comes to gathering feedback, not all surveys are created equal. Traditional online surveys typically rely on text-based questions and answers, asking respondents to read and type or select from written options. While these surveys are effective for many types of research, they can sometimes lead to lower engagement and less detailed responses, especially if the questions are lengthy or complex.
Image-based surveys, also known as photo surveys or picture surveys, take a different approach by incorporating images as either the questions themselves or as answer options. This visual format is proven to boost response rates and encourage higher engagement among survey participants. By using images, researchers can collect more nuanced and meaningful data, as visuals often prompt more instinctive and honest feedback compared to text-based surveys. For example, showing a series of product photos and asking participants to select their favorite can reveal preferences that might not surface through words alone.
Compared to traditional surveys, image surveys make it easier for respondents to process information quickly and provide more accurate answers. Researchers have found that using images helps gather richer feedback, making it possible to explore opinions, preferences, and emotions in ways that text alone cannot. Ultimately, choosing between online surveys and image-based surveys depends on your research goals, but incorporating images is a powerful way to collect and analyze data that truly reflects your audience’s views.
5 Things to Avoid with Image-Based Surveys
While creating a visual survey can greatly improve data accuracy and response rates, there are a few things you should try to avoid. It’s important to experiment with different question types and select the right question type for your survey goals, as experimenting with various question types—such as click map, multiple-choice, or open-ended—can help you identify the most effective format for collecting valuable insights.
1. Picture Size
Size matters when it comes to photo selection, especially if you’re asking respondents to vote on images. Be sure the subjects of the photos are always similar in size to be fair and impartial. Ensuring all uploaded images are similar in size helps maintain fairness and consistency. In the example below, you can see how poor Jaguar gets the short end of the stick, with a much smaller logo than the other auto manufacturers. This could have a significant impact on respondents’ image selection.

Note: Visual example created using SurveyLegend’s survey tool
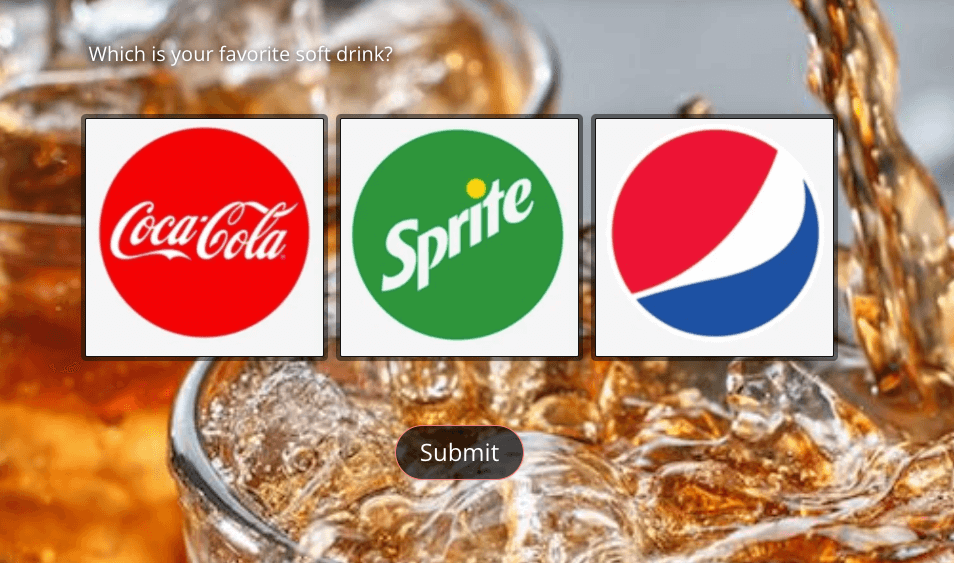
2. Background Image
The choice of imagery used in the background is also a consideration. In the example above, a neutral blue background with white bubbles representing soda was used. Now, in the image survey example below, although the Pepsi logo has been corrected, a background with a brown cola image has been chosen. Background images can represent certain products or brands, which may influence how respondents perceive the options and potentially affect their choices. This could subconsciously lead someone to select the brown-colored sodas, Coca-Cola or Pepsi, instead of the clear soda, Sprite.
Note: Visual example created using SurveyLegend’s survey tool.
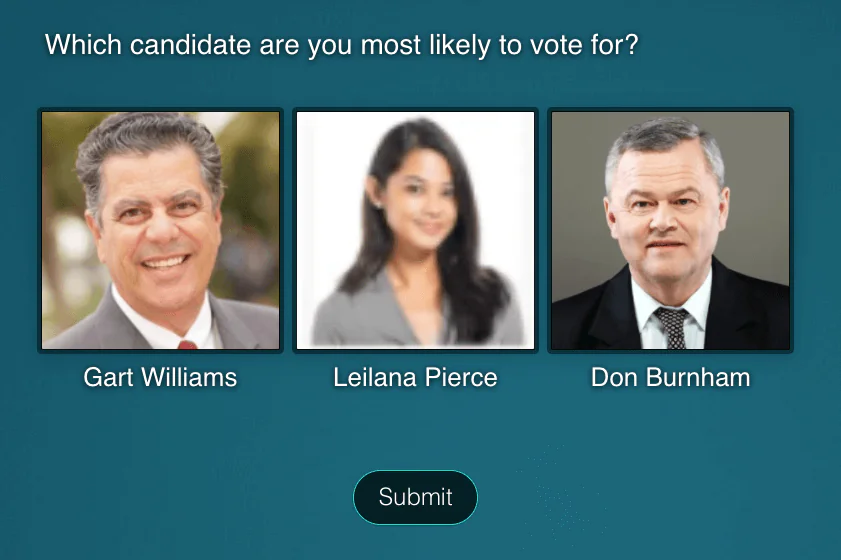
3. Picture Quality
Each image selection should be of high quality to give impartiality to each (the standard resolution for web images is 72 PPI, or pixels per inch). As you can see in the example below, “Leilana” is unfairly represented with a low-resolution photo, which could impact people’s selection process.
Note: Visual example created using SurveyLegend’s online survey.
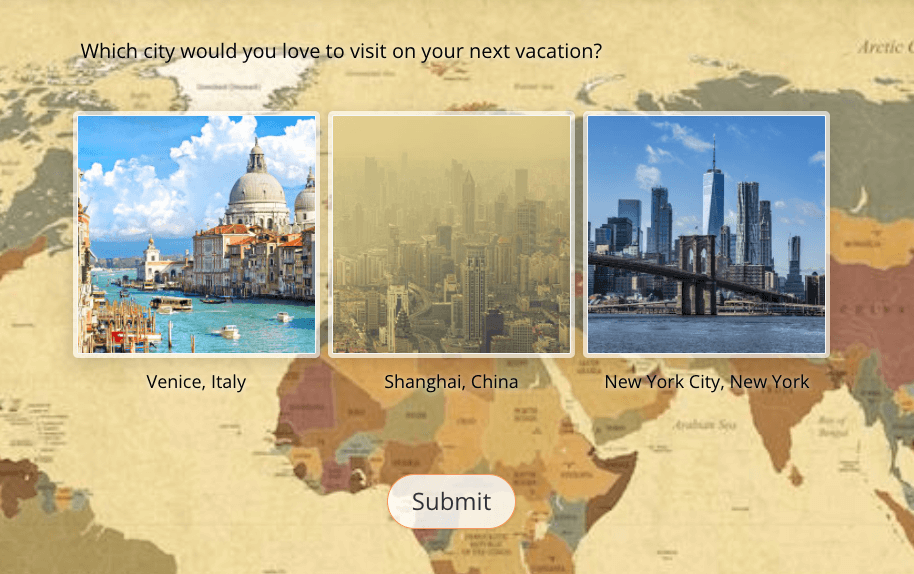
4. Picture Choice
You can do everything right, but then make the mistake of choosing a photo that’s not flattering or not representative of the subject on any given day. In the extreme example below, New York and Venice are photographed on a beautiful day, while Shanghai, in this particular picture poll, is experiencing an unusually smoggy day. This can certainly influence a respondent’s image selection.
 Note: Visual example created using SurveyLegends online survey, form, and polling tool.
5. Image Interpretation
When using images, especially those that are emotion-based, you don’t want people to take them too literally. Check out the sample image poll below, about a new body wash. Now, body wash isn’t something most people are going to get too excited about one way or the other. So, if they vote on images literally, very few are likely to choose #1 or #5. So, you’ve essentially whittled your five-answer survey down to three answers. Carefully designing image answer options can help ensure respondents interpret and select answers as intended. Instead, you might have chosen less dramatic faces for anger/disgust and happiness/ecstasy.
 Note: Visual example created using SurveyLegends online survey, form, and polling tool.
Using More Than One Image: When and How
There are times when using more than one image in a survey question is not just helpful, but essential. For example, if you want survey takers to compare different ad concepts, product designs, or packaging options, presenting multiple images side by side allows respondents to make direct comparisons and provide more informed feedback. This approach is especially useful in market research, where visual choices can reveal subtle preferences that might be missed in text-based surveys.
However, it’s important to use multiple images thoughtfully. To keep your survey user-friendly and avoid overwhelming respondents, limit yourself to no more than four images per question. Too many images can clutter the interface and make it harder for participants to focus, which may reduce the quality of the feedback you gather. Each image should be high-quality, clearly labeled, and directly relevant to the question being asked. Consistency in visual style—such as using similar backgrounds, lighting, or framing—also helps respondents compare images more easily and keeps your survey looking professional.
By following these best practices, you can create engaging surveys that encourage participants to compare, evaluate, and provide valuable insights on more than one image at a time, all while maintaining a smooth and enjoyable survey experience.
One Image Per Question: Best Practices
In many image surveys, using one image per question is the best way to keep things clear and focused. This method allows respondents to concentrate on a single visual at a time, making it easier for them to understand the context and provide accurate feedback. When you use one image per question, make sure the image is directly related to the question and represents the topic or target audience you’re interested in.
High-quality images are essential—blurry or poorly composed photos can confuse respondents and lower response rates. Choose visuals that are relevant and relatable to your audience, whether you’re testing product concepts, gauging reactions to ad campaigns, or exploring customer preferences. Providing context through the image itself or a brief caption can also help clarify what you’re asking, leading to more meaningful responses.
By focusing on one image per question, you create a straightforward and engaging survey experience that encourages respondents to share their honest opinions, resulting in higher-quality data and more actionable insights for your research.
Testing Your Survey Before Launch
Before sending your image survey out into the world, it’s crucial to test it thoroughly. Piloting your survey with a small group of colleagues or members of your target audience can help you spot any issues with image choice, question wording, or the overall flow of the survey. This step is especially important for image surveys, as visuals can sometimes be interpreted differently by different people.
Make sure to test your survey on a variety of device types, including mobile devices, tablets, and desktops. A user-friendly survey should display images clearly and function smoothly, no matter what device respondents are using. Pay attention to how images load, whether answer choices are easy to select, and if the survey is easy to navigate from start to finish.
Gather feedback from your testers about their experience—did they find the images clear and relevant? Was the survey engaging and easy to complete? Use their insights to refine your survey, making adjustments to image choice, wording, or layout as needed. By investing time in testing, you’ll create a more effective and engaging survey that delivers high-quality data and valuable insights.
Collecting Responses and Data Analysis
Once your image survey is live, the next step is to collect responses and analyze the data. Image surveys can yield rich, detailed feedback, especially when you ask respondents to react to or choose between different images. To make the most of this data, use a survey tool that supports real-time tracking, data visualization, and customizable reporting features.
As responses come in, look for patterns and insights in how participants interact with your images. Are certain visuals consistently chosen over others? Do specific images prompt more detailed feedback or stronger opinions? Present your findings using charts, graphs, or image-based reports to clearly communicate what you’ve learned.
Careful analysis of your image survey results can reveal valuable information about your target audience’s preferences, opinions, and behaviors. These insights can inform business decisions, shape marketing strategies, or guide product development. By leveraging the power of image surveys and robust data analysis, researchers can gain a deeper understanding of their audience and make more informed choices moving forward.
Conclusion
With the average response rate for online surveys falling between 10% and 30%, researchers have their work cut out for them. However, science shows that we’re extremely visual beings, so why not create a poll with pictures? You’ll collect more responses and improve the accuracy of your data, so it’s a real win-win (be sure to check out our blog on the 7 advantages of image-based surveys).
Of course, just as the wrong wording can turn a survey question into a leading question, the wrong image can influence survey respondents, too. So, always be sure you’re choosing fair and impartial photos or illustrations to be sure your survey results are valid. Once you’ve found your visuals, SurveyLegend makes it easy to create a free poll with images! With SurveyLegend, images can be resized and moved around, complementing questions or answers, or used to create beautiful, welcoming backgrounds. You’re also not limited to the types of image polls and image-based surveys you can create; for example, you can make clickable image polls, visual-based multiple-choice selections, ranking surveys with emojis, and much more. You can also track how each respondent interacts with images, rank options, and gather ideas or gauge interest in new concepts.
Have any other tips for researchers creating image-based surveys? Have you found them to be more successful than text-based surveys? Let us know in the comments!
You can also embed a photo survey on your website to collect feedback and improve user experience.
Frequently Asked Questions (FAQs)
What is an image-based survey?
Rather than just using text-based questions, image-based surveys use photos and illustrations as questions or answers to better engage respondents. Higher engagement leads to better response rates and ultimately, more accurate data.
Is there data that supports using image-based surveys?
Overwhelmingly. Since 90% of the information processed by humans is visual, and our brains take just 13 milliseconds to process an image, visuals are much more powerful than text only. Plus, in a survey, 95% of buyers said that they wanted shorter and highly visual content.
Can survey visuals influence respondents?
Survey images are meant to aid in understanding, not influence. However, if the researcher chooses unflattering photos, unfairly sizes certain photos in relation to others, or chooses low-quality resolution photos, results could be skewed. So, always choose a fair and impartial survey image.