Simple random sampling is a probability sampling method in which every member of a population has an equal chance of selection. It’s widely used because it’s unbiased, easy to conduct, inexpensive, and typically provides a representative sample. Researchers define the population, choose a sample size, assign numerical values, and use random tools—like lottery methods, random number tables, or computer generators—to select participants. Although highly effective, drawbacks include potential sampling errors and issues if population lists are incomplete. When executed properly, simple random sampling provides reliable, objective data for research and surveys.
Create your FREE Simple Random Sampling Survey, Poll, or Questionnaire now!
Need to survey a large group of people, but don’t have the time or money to survey them all? Simple random sampling is a great option, and is one of the easiest ways to survey a smaller subset of a larger population. So how does it work? In this blog, we look at the five-step process, various methods, and simple random sampling advantages and disadvantages.
Simple Random Sampling Definition
The simple random sampling technique (sometimes called a “method of chances”) involves selecting a smaller group of participants (the sample) from a larger group of participants (the population), where participants are chosen randomly from the population. This method uses random selection to give everyone from the total population an equal chance of being selected, ensuring objectivity and lack of bias. Because the selection process is random, the end sample is also more likely to be representative of the total population. So, why is simple random sampling “simple”? Because there is no easier way to extract a research sample from a larger population! Plus, because the sample is selected at random, a lot of issues associated with survey bias are eliminated.
Create your FREE Simple Random Sampling Survey, Poll, or Questionnaire now!
Simple random sampling is a type of probability sampling, where each member of the population has a known, non-zero chance of being selected.
So, why is simple random sampling “simple”? Because there is no easier way to extract a research sample from a larger population! Plus, because the sample is selected at random, a lot of issues associated with survey bias are eliminated.
Methods of Simple Random Sampling
When population size is small, researchers may use the “lottery method.” For example, a company with 75 employees may want to get the opinion of 10 employees. They literally put 75 names in a hat and select 10 at random. This method is used to create random samples from the population. Because employees who make up the subset of the larger group are chosen at random, each individual in the large population set has the same probability of being selected. This generally creates a sample that is representative of the larger group as a whole.
Other times, researchers may use a random number table, which can be found in research books or online. These tools help select a random subset of individuals from the entire data set, ensuring unbiased results. When organizing and managing the population data, you can enter names into an Excel spreadsheet for easier handling and analysis.
Create your FREE Simple Random Sampling Survey, Poll, or Questionnaire now!
When sample sizes and/or the participant population are very large, selecting a random sample is usually not feasible unless you’re prepared to spend a lot of time and money. For larger populations, manual methods become impractical, and computer-aided processes are preferred. To get around this, most researchers use computer-aided simple random sampling methods. This could be as simple as using a tool like the random number generator available on Calculator.net. You can also generate random numbers within an Excel spreadsheet using formulas such as =RAND() or =INT(1000*RAND())+1.
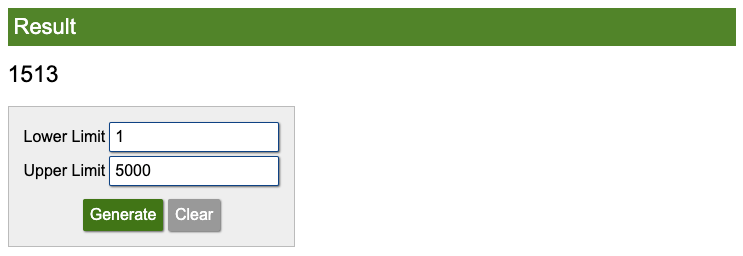
Let’s say you have a population of 5,000 but only want to select a random sample of 100. Simply adjust the limits and click “Generate.” A random number is revealed (in the screenshot below, it’s 1513). Do this 100 times, and you’ll have your simple random sample. Alternatively, you can set your desired sample size by copying the random number formula into 100 cells in your Excel spreadsheet to generate a random subset from the larger population.
Create your FREE Simple Random Sampling Survey, Poll, or Questionnaire now!
For more, be sure to check out our blog on How to Determine Sample Size for Your Survey.
5-Step Simple Random Sampling Process
Researchers generally follow a simple random sampling process, which includes five steps. We’ve listed them below and included a simple random sampling example.
1. Define the Population
The first step is to determine the population base. This is the group of people whom you wish to learn more about via surveys. You want to be sure that the population you identify will adequately cover the outcome you are trying to solve for. For example, say you want to understand how consumers feel about new product packaging. Your population, then, is everyone who has bought the product with new packaging in the last 30 days.
Create your FREE Simple Random Sampling Survey, Poll, or Questionnaire now!
2. Choose Sample Size
Because surveying everyone who purchased the product would be a big undertaking, next, you would determine how many people from the total population you will survey. Remember to pick a sample size large enough to be truly representative of the population. In our example above, let’s say 5,000 people purchased the product in the last 30 days. A good sample size is usually around 10% of the population, as long as this does not exceed 1000. So, you would need a randomly selected sample size of 500.
3. Determine Population Units
This step entails putting together a list of all people within your population. Using our example, you would use existing purchasing data for the last 30 days to gather the names of everyone and enter them into a spreadsheet.
Create your FREE Simple Random Sampling Survey, Poll, or Questionnaire now!
4. Assign Numerical Values
Next, it’s time to give each person in the population group an unrelated numerical value. Because randomization comes next, this could be as simple as giving the first person on the list a 1 and the last person 5000.
5. Select Random Values
Now, it’s time to randomize. From our numbered list of 5,000 people, you would randomly select 500 as your sample group. You could use the random number generator highlighted earlier, generating random numbers 500 times and highlighting the individuals on the list with the corresponding number. The final sample consists of those individuals whose numbers were selected. This process helps ensure that your sample is a balanced subset of the larger population. Congratulations, now you have your simple random sample!
Create your FREE Simple Random Sampling Survey, Poll, or Questionnaire now!
Advantages and Disadvantages of Simple Random Sampling
Simple random sampling research has many benefits, which make it a popular choice for researchers. Here are the advantages of this sampling technique.
- Easy to conduct. Unlike more complicated sampling methods, researchers do not need to divide the population into subpopulations or take any other additional steps before selecting members. They simply select a random number of people from the total population.
- Good representation. Because the smaller sample is generated randomly, it is generally assumed that the group is representative of the entire population of participants. This means no further segmenting is needed to refine groups.
- Inexpensive. Because you’re simply pulling names from an existing population, no further segmentation is needed to refine groups. This cuts down survey costs significantly.
- Unbiased results. This method of sampling is generally unbiased; since the technique gives every participant a fair chance, the resulting sample is unaffected by the research team.
- Convenient. Usually, data sets are already listed or digitally stored for the entire population. Whittling the list down to a manageable sample is as easy as randomly selecting people from the existing list.
- Part of probability sampling techniques. Simple random sampling is one of several probability sampling techniques. Other random sampling techniques include stratified random sampling, cluster sampling, and systematic sampling, each with its own procedures and advantages.
Create your FREE Simple Random Sampling Survey, Poll, or Questionnaire now!
When comparing simple random sampling to other sampling approaches, it’s important to consider your research goals and the structure of your population. Stratified sampling, for example, divides the population into smaller groups, or strata, based on shared characteristics such as age, gender, or industry. A stratified random sample is then drawn from each stratum, ensuring that all subgroups are represented in the final sample. This method is especially useful when you want to make sure that specific segments of the population are adequately sampled.
Cluster sampling, on the other hand, involves creating comparable groupings, or clusters, such as schools, zip codes, or companies. In one-stage cluster sampling, entire clusters are sampled, while in two-stage cluster sampling, clusters are first randomly selected, and then individuals within those clusters are randomly sampled. This approach is often used when it is difficult or costly to sample individuals from a large population directly.
Create your FREE Simple Random Sampling Survey, Poll, or Questionnaire now!
Systematic sampling is another probability sampling technique where the researcher randomly selects a starting point from the list of the whole population, then samples every nth participant at a fixed interval. While systematic sampling is efficient and reduces clustering bias, not all subsets of the population have the same chance of being selected, unlike simple random sampling.
The goal of these sampling techniques is to collect data from a sample that accurately represents the entire data set, without having to survey the whole population. In all probability sampling techniques, the sample is sampled in such a way that each individual ideally has the same chance of being selected, though some methods, like systematic sampling, may not guarantee this for all possible subsets.
Create your FREE Simple Random Sampling Survey, Poll, or Questionnaire now!
Simple random sampling is best suited for situations where the whole population is accessible and a complete sampling frame is available. However, for large populations, this method can be time-consuming and resource-intensive. In such cases, computer-aided random sampling techniques are often necessary to efficiently manage the process.
Choosing the right sampling approach is crucial for your research. While simple random sampling is straightforward and unbiased, stratified sampling ensures representation of all subgroups, and cluster sampling is practical for large or geographically dispersed populations. Understanding the differences between these random sampling techniques helps ensure your sample is representative and your results are reliable.
Create your FREE Simple Random Sampling Survey, Poll, or Questionnaire now!
Happily, the list of drawbacks to simple random sampling is much shorter. Here are two ways this sampling technique could backfire.
- Incomplete population demographics. If you’re working with Incomplete population demographics, certain groups could be excluded from the sample.
- Sampling errors. A random sampling isn’t always going to accurately reflect the population it is supposed to represent. An example of simple random sampling failing would be if you pull a sample of 25 people from a population of 100. It’s possible, though unlikely, that you could draw 25 men and 0 women, which could skew your results by not including a female perspective.
Best Practices for Simple Random Sampling
Simple random sampling is a powerful sampling method for drawing unbiased conclusions from a larger population, but its effectiveness depends on how well you implement the process. To get the most accurate and representative results, keep these best practices in mind:
Create your FREE Simple Random Sampling Survey, Poll, or Questionnaire now!
- Start with a complete sampling frame. Make sure you have a comprehensive list of every individual in your target population before you begin. Missing members can lead to bias and reduce the accuracy of your random sample.
- Use reliable randomization tools. Whether you’re using a random number table, a random number generator, or the lottery method, always choose a method that ensures each member of the larger population has an equal chance of being selected. Digital tools can help eliminate human error and speed up the process.
- Double-check for duplicates. When randomly selecting your sample, ensure that no individual is chosen more than once, unless your sampling method specifically allows for it. This helps maintain the integrity of your sample.
- Determine an appropriate sample size. The size of your sample should be large enough to accurately represent the entire population, but manageable for your data collection resources. Consider the diversity of your population and the goals of your research when deciding on sample size.
- Document your process. Keep a clear record of how you performed your random sampling, including the tools and methods used. This transparency is important for validating your results and for future reference.
- Review and update your sampling frame as needed. If your population changes over time, make sure your list stays current to maintain the equal probability of selection for all members.
Create your FREE Simple Random Sampling Survey, Poll, or Questionnaire now!
Create your FREE Simple Random Sampling Survey, Poll, or Questionnaire now!
By following these best practices, you can perform simple random sampling in such a way that your sample is truly representative of the larger group, ensuring your research findings are both reliable and unbiased.
Simple Random Sampling with Online Image Surveys
As with any survey, to improve your response rates to avoid having to find a new random sample, consider using online surveys with photos. With SurveyLegend, our picture surveys boost engagement, help trigger respondent emotion and memory, and cross language barriers. They’re ideal when conducting simple random sampling! Below is an example of one of our photo surveys, designed to match the product packaging example we’ve used in this blog. You can also create polls with pictures, questionnaires with images, and much more.

Create your FREE Simple Random Sampling Survey, Poll, or Questionnaire now!
Conclusion
Simple random sampling is an easy way to survey smaller subsets of a large population, without introducing survey bias. While this approach has some drawbacks, the advantages tend to far outweigh them. Whether you choose this or another technique, we’ve got you covered. SurveyLegend lets you start for free and has dozens of beautiful and responsive online survey templates from which to choose. Do you use simple random sampling when conducting surveys? What do you feel are the biggest pros and cons of this method? Let us know in the comments!
Create your FREE Simple Random Sampling Survey, Poll, or Questionnaire now!
Frequently Asked Questions (FAQs)
What is simple random sampling?
Simple random sampling involves selecting a smaller group of participants from a larger group of participants. The sample is chosen at random to lessen the chance of bias and give everyone from the total population an equal chance of being selected.
Why should you use simple random sampling?
This sampling method is generally easy and inexpensive, and because it is randomized, the sample is usually representative of the larger population.
How do you make sure your sample is randomly chosen?
Most researchers use one of the following methods to select a sample at random: – Lottery method, such as drawing names from a hat, flipping a coin, and other physical means of selection. – Random number tables, which can be found in research books or online. These can be used to select respondents based on corresponding numbers. – Random number generators, which can be found online. They automatically generate a number between a set limit, which can be used to pull a participant with a corresponding number.