
What Is a Sample Size in Market Research?
In marketing research, sample size refers to the number of people chosen for a survey from the total population of that demographic. For example, say you want to know what teachers think about virtual classrooms. It’s unrealistic to attempt to survey every teacher in the country, so you choose a sampling of them to represent all of them. This could be a couple of thousand teachers, for example, versus the millions of teachers out there.
On the other hand, perhaps you’re simply surveying your small company of 50 people. In this case, you’ll want to shoot for 100% participation.
4 Sample Size Considerations
So how do you determine a sample size? Before diving into how to calculate your sample size, it’s important to remember that all individuals for your target audience must have an equal chance to be chosen. Otherwise, there can be a sampling bias. This happens when researchers fail to choose participants properly.
Ideally, research participants are chosen at random. Otherwise, the survey’s validity can be compromised because it doesn’t accurately reflect the greater population.
One well-known example of sampling bias impacting a survey occurred in 1948 when Harry S. Truman and Thomas E. Dewey were running for President. To predict the winner, a nationwide political telephone survey was conducted, and the results heavily favored Dewey. Thinking they knew the outcome, a confident Chicago Tribune printed their newspaper with the headline “Dewey Defeats Truman” … but when the final tally was revealed, Truman won.
So what went wrong? In 1948, only wealthy families could afford to own telephones, and the upper-classes heavily favored Dewey; meanwhile, lower and middle-class families, who didn’t own telephones, backed Truman. The researchers failed to consider that by sampling only by phone, they weren’t getting an accurate sampling of the total population.
1. Total Population Size
First, it’s important to try to determine the population size of your target group. For example, a quick Google search reveals that there are an estimated 3.7 million active teachers. For some studies, it will be more difficult to get a number like this, however, you don’t need an exact number; many studies get underway with an unknown number or an estimate.
Of course, you could look for similar studies that have been conducted in your field and use their sample size as a guide; however, you will be relying on them to have done the correct sample size calculation, so it’s best to determine this one on your own.
2. Margin of Error/Confidence Interval
There are bound to be some errors in any survey; it’s a matter of determining how much error is acceptable. The margin of error, also known as the confidence interval, highlights how many percentage points your survey results may vary from the total population. You’ve probably seen this plus-or-minus figure reported in newspaper or television opinion poll results: 55% of voters say they’ll vote yes (+/- 5%).
The confidence interval formula is a bit complicated, so an easy way how to find margin of error is this free margin of error calculator.
3. Confidence Level
Not to be confused with the confidence interval, this simply shows how sure you can be of your results. It is expressed as a percentage and represents how often the target population would choose an answer within the margin of error/confidence interval. The most common confidence level is 95%, though some researchers use 90% while others shoot for 99%.
4. Standard Deviation
The standard deviation shows how far individual responses to a question vary, or “deviate”, from the mean. They show researchers how spread out the responses are: are they concentrated around the mean, or scattered? Back to our teacher example, did all the teachers feel pretty neutral about virtual learning, or did some love it and others hate it?
A good bet for standard deviation is .5, but you can use this free standard deviation calculator if you want to get more accurate.
How to Calculate Sample Size
Now, with your sample size considerations nailed down, ready to determine your sample size? Get out your calculator and we’ll show you how it’s done.
First, turn your confidence level into a Z-score. For the common 95%, that’s 1.96 (want a different confidence level? Here’s the full chart).
Now, if you know your population size, you’ll want to use the standard formula:
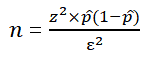
n = Population Size (Calculate this with the formula below)
- z = Z-score
- e = Margin of Error
- p = Standard Deviation
Do you have an unknown or extremely large population? Try this formula:
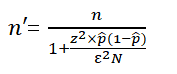
- z = Z-score
- e = Margin of Error
- p = Standard Deviation
Not really a fan of math? No problem. There are a number of sample size calculators out there that are free like this one on Calculator.net.
Conclusion
Determining the correct sample size is important if researchers want accurate and statistically significant results. So how do you determine the ideal sample size? To wrap up, let’s go back to the Goldilocks Principle.
A sample size that’s too small could include a disproportionate number of people who are outliers (their opinion is very different from the majority, but since the sample size is too small, they skew the results). On the other hand, a sample size that’s too big could become too complicated, costly, and time-consuming, outweighing the benefit of high accuracy.
So, when conducting your next survey, do your due diligence when determining sample size to wind up with an accurate, statistically significant survey. And, be sure to check out SurveyLegend to create your beautiful, responsive, and secure email surveys or polls.
How do you determine sample size? Do you do the calculations by hand, or use a sample size calculator? Let us know how you get the job done in the comments!
Frequently Asked Questions (FAQs)
Sample size is the part of a population chosen for a survey. The population could be large, such as all American citizens, or small, such as employees at a startup business.
Also known as the confidence interval, the margin of error shows many percentage points a researcher’s survey results may differ from the total population.
Confidence level demonstrates how certain a researcher can be of their survey results.
The standard deviation shows how far individual responses to a question vary, or “deviate,” from the average.