What is Margin of Error?
Margin of error (or confidence interval) informs people of how much they can expect survey results to reflect the views from the total population. This is important because the smaller sample used for a survey may not always be completely representative of the greater population.
Margin of error is expressed as plus or minus a certain number of points. For example, a plus or minus 4 percentage points at a 95% confidence level means that if a surveyor fielded the same survey 100 times, the expected result should be within 4 percentage points of the true population value 95 of those times.
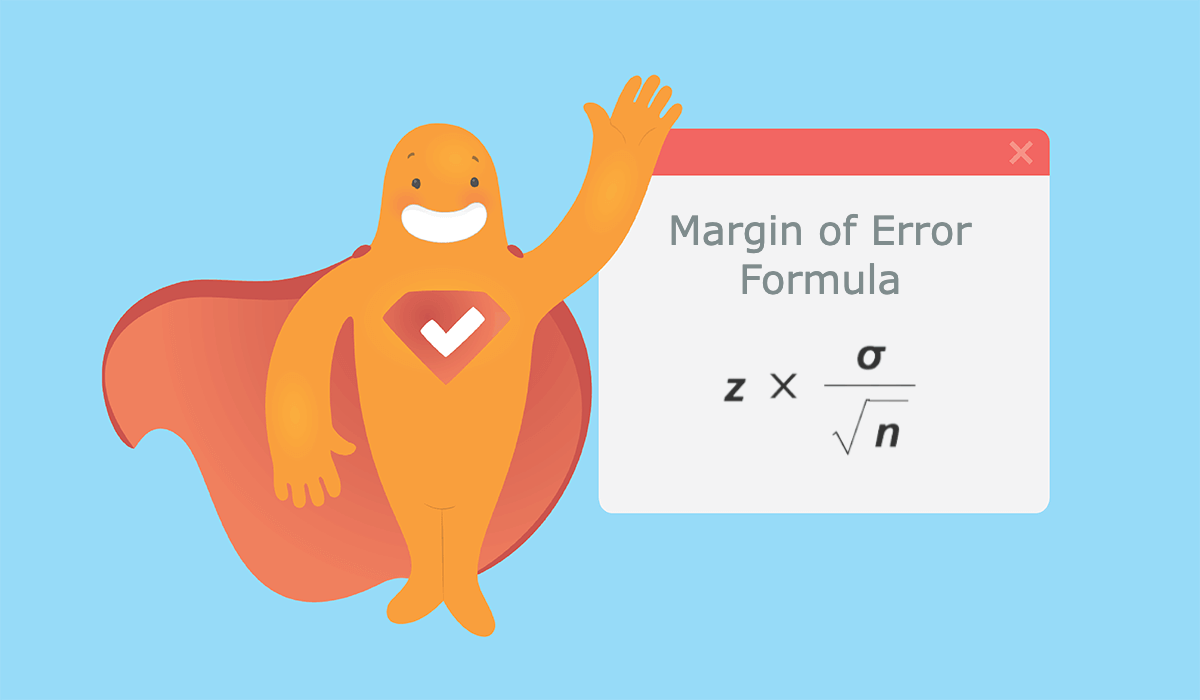
Margin of Error Formula
The margin of error formula is a range of values above and below the actual results from a survey. For example, a 70% “yes” response with a margin of error of 5% means that between 65% and 75% of the general population think that the answer is “yes.”
Now, let’s take a look at the margin of error formula with a hypothetical example.
Let’s say you’re testing a new product with a target audience of 5,000 – this is your total population. Now, you don’t want the expense of surveying them all, so you choose 10% of the total population, or 500 people – this is your sample size. To calculate margin of error in this scenario, you would use the following formula:
Steps to Calculate Margin of Error
- Plug in the population standard deviation (σ) and sample size (n). Need to calculate your sample size? Check out our blog on Survey Sampling and Data Collection.
- Get the square root of your sample size and divide it into your population standard deviation.
- Multiply the result by the z-score that matches the confidence interval you hope to achieve.
Margin of Error Calculations
Now, you may not be a mathematician. So, we recommend using Calculator.net, an awesome free online calculator for all your needs. Just plug your numbers into the margin or error calculator, and voila! You’ll have the number you need. Here are the results from our example.
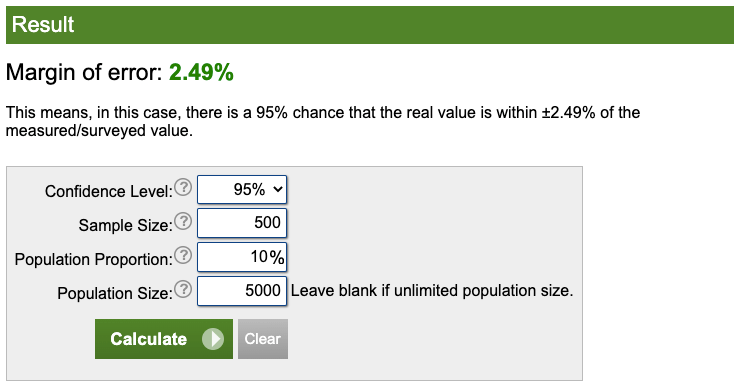
Now, let’s say your survey reveals that 80% of respondents sampled like your product. With a confidence level of 95% and a margin of error of 2.49, this means between 77.5% and 82.5% of the total population will like your product.
Note: If you have an unlimited population size, leave that field blank and use a population proportion of 50%.
Adjusting Sample Size
What do you do if you calculate your margin or error and find it to be unacceptable? If the margin is too great, your results may not be in line with the general consensus of the total population.
In this case, you’ll need to adjust the sample size numbers in the calculator until you arrive at an acceptable margin. Then, you’ll have to adjust the number of surveys you send to match. Again, be sure to check out our blog, Survey Sampling and Data Collection.
7 Factors Influencing Margin of Error
There are many factors that can impact the results of a survey. Without a margin of error, your results can deviate from reality, and incorrect assumptions or decisions can be made. With a margin or error, you’re allowing for “wiggle room,” which is especially important if you’re straddling the line between acceptable and unacceptable. Here are the top seven reasons to use a survey margin of error.
1. Sampling Bias
Sampling bias tends to happen when the sample population isn’t chosen at random, impacting the validity of a survey because the total population isn’t accurately represented. An example of this is a telephone survey that doesn’t take into consideration that many people no longer have landlines, or an online survey that doesn’t consider that the very elderly may not be active on the internet.
Learn more about sampling bias as it pertains to political polls, which almost always use a margin of error.
2. Biased Questions
There are a variety of questions that, whether intentionally or not, introduce bias into a survey necessitating the need for a margin of error. The three most common biased questions include:
- Leading questions, which “lead” respondents toward a “correct” answer by wording questions in a way that sways readers to one side or by providing more options on one side of a scale question.
- Loaded questions, which basically force respondents to answer a question in a particular way by not providing answers such as “not applicable” or “other.” Read more in our blog on Leading Questions & How They Differ From Loaded Questions.
- Double-barreled questions, which puts two questions in one, leaving respondents unsure of how to answer. For example, the question “Do you approve of the President and all of his policies” is double-barreled, as someone may approve of the President but not all his policies.
3. Incentive Seekers
Some people will lie in order to be selected for a survey if an incentive is offered. For example, fudging demographic questions if they think it will help them be selected for participation. For example, if it’s a NRA survey on gun control, they may assume the researcher is looking for Republicans so they may lie about their political party.
4. Influencing Outcomes
Sometimes, people try to influence the outcome of a poll. They may state that they’re voting for the opposite party they belong to, hoping the results favoring that party will rally their own party to ensure a victory.
In another example, they may state they would not spend more than $250 on a new phone (even though they’d spend up to $500), in hopes that when the product is released it will be at the more affordable price point.
5. Malicious Intent
Sometimes people just want to maliciously skew survey results. They may not like the company or party conducting the survey, may not like the way questions are worded, or may just be irritated by the survey and, out of annoyance, intentionally try to screw up the results.
6. Non-Response Error
This occurs when the likelihood of responding to a survey is related to how one would have answered the survey. For example, in political polls, supporters of a trailing candidate are less likely to respond to surveys, biasing the result in favor of the more popular politician.
7. Dishonest Answers/Honest Mistakes
People aren’t always forthcoming with the truth on surveys. Sometimes, they may provide socially-desirable answers when responding to hot-button topics. Topics could include abortion, race relations, LGBT rights, gun ownership, and so on. They may feel embarrassment or shame over their true feelings. They may think they appear “old-fashioned” or “out of touch with society,” and answer the opposite of their beliefs.
Of course, people also make honest mistakes. This may occur when a question is unclear to the respondent. Or, they may be rushing to complete the survey and not clearly reading the questions and answers.
Conclusion
Nobody’s perfect – so surveys can’t be, either! To account for potential biases or mistakes on the part of the survey maker or survey taker, calculating a margin of error is very important. This is especially true for surveys that influence decision making. Of course, when you’re ready to create your survey, count on SurveyLegend. Our online surveys are beautifully rendered and allow you to add images to surveys. Picture surveys are proven to further increase engagement and improve question and answer clarity! See for yourself and start with SurveyLegend today!
Do you use a margin of error on your surveys? Which confidence level do you typically strive for? Let us know in the comments!
Frequently Asked Questions (FAQs)
Margin of error (or confidence interval) informs people of how much they can expect survey results to reflect the views from the total population.
Margin of error is expressed as plus or minus a specific number of points. For example, if a survey reveals 60% of respondents approve of a candidate, the margin of error may be +/- 3. This means the real value could be 57% to 63%.
A confidence level says that if the same survey is administered 100 times, the expected result would be achieved a certain amount of times. For example, if the confidence level is 90%, the expected result would be achieved 90 times out of 100.