Likert Scale Definition: History and Usage
What is a Likert scale, and how do you use one? Firstly, the Likert scale is named after American social scientist Rensis Likert. Likert devised the psychometric approach in 1932 for conducting social and educational research. The Likert scale is a type of psychometric scale used to measure people’s attitudes and opinions by capturing respondents’ perceptions on a continuum. Today, Likert-type scales are considered some of the best survey tools for researching popular opinions. As a result, they’re often used for customer satisfaction surveys or marketing research surveys.
On a Likert scale, a person selects one option among several response choices that reflects how much they agree with a statement. In other words, the scale generally consists of five or seven balanced response choices that people can choose from, with a neutral midpoint. However, there can be as few as two responses (with no neutral response) or as many as ten. Carefully constructing Likert items is essential to ensure reliable and valid measurement of attitudes. Likert survey questions are a popular format for gathering detailed feedback and understanding customer attitudes and experiences. Now, it’s very common for companies to use these scales when they want to evaluate a customer’s level of satisfaction during a recent experience.
Create your Likert-based survey, form, or poll now!
Later on, you’ll see many examples of Likert survey scales. Likert scales are a type of rating scale commonly used in research to measure opinions and attitudes. However, to be sure we’re on the same page, here’s a typical question using 5 points:
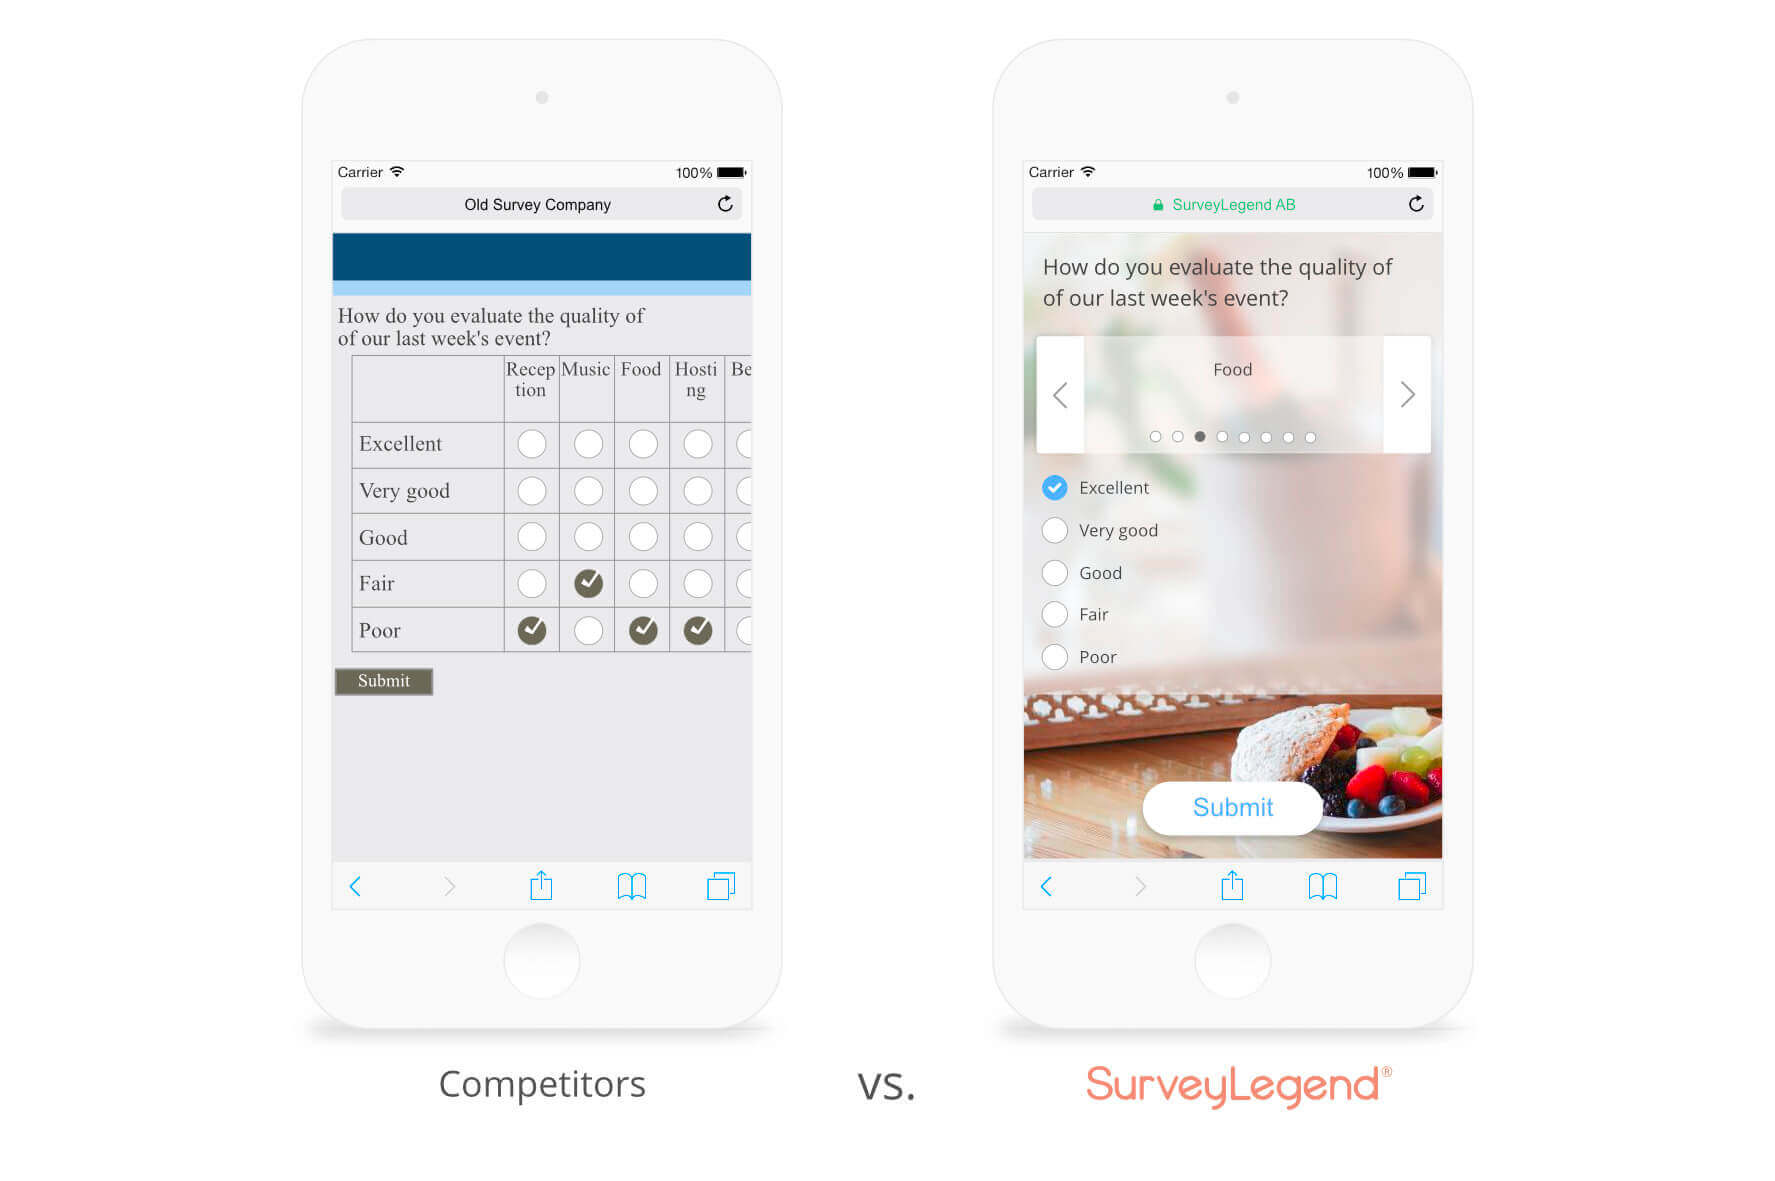
SurveyLegend provides quality support to its customers, including features like Live Analytics for real-time, visually appealing survey insights:
- Strongly Disagree
- Somewhat Disagree
- Neither Agree Nor Disagree
- Somewhat Agree
- Strongly Agree
Create your Likert-based survey, form, or poll now!
A good Likert scale features clear statements and distinct response choices, ensuring that the full range of possible opinions is represented and that respondents can accurately express their views.
Hint: The correct answer is 5…at least that’s what our customers* are saying!*
When choosing the number of responses, it’s important to provide a full range of response choices to accurately capture the spectrum of participant opinions. Additionally, the way you present questions can significantly impact response quality and engagement.
Create your Likert-based survey, form, or poll now!
How Likert Scales Work
Likert scales are a widely used type of rating scale designed to measure people’s opinions, attitudes, or perceptions in a structured way. When you use a Likert scale in your survey research, you present respondents with a series of statements or questions and ask them to indicate their level of agreement or disagreement. This is typically done using a scale with multiple points, such as a 5 point Likert scale or a 7-point scale, with response options ranging from “strongly disagree” to “strongly agree.”
The power of Likert scales lies in their ability to transform qualitative data—like personal feelings or attitudes—into quantitative data that can be analyzed. Each Likert scale response is assigned a value, allowing you to measure opinions and customer attitudes with greater precision. For example, a 5 point Likert scale might include the following response categories: strongly disagree, disagree, neither agree nor disagree, agree, and strongly agree. This structure makes it easy for survey respondents to express their views, while giving researchers a consistent way to collect and compare data.
Likert scale data is typically considered ordinal, meaning the responses have a clear order but the intervals between them may not be exactly equal. However, in some cases—especially when using multiple Likert scale questions—researchers may treat the data as interval data to perform more advanced statistical analysis, such as t-tests. This flexibility is one reason why Likert scales are so popular in market research, medical education, and social sciences.
Create your Likert-based survey, form, or poll now!
When designing a Likert scale questionnaire, it’s important to carefully choose the number of scale points and the wording of your response options. Too few points can limit the accuracy of your results, while too many can confuse respondents or lead to response bias. A 5 point Likert scale is often considered a good balance, but a 7-point scale can provide more granularity if needed. The key is to ensure that each response option is clear, concise, and relevant to the question being asked.
Likert scale surveys are especially useful for measuring different aspects of customer satisfaction, employee engagement, or public opinion. For example, organizations can use Likert scales to understand how employees feel about training opportunities, career growth, or organizational policies, helping to gauge overall engagement and satisfaction. They can also be adapted into bipolar scales, which measure two opposite attitudes or feelings. To analyze Likert scale data, researchers often use descriptive statistics like frequencies, percentages, and bar charts to visualize the distribution of responses. For more in-depth analysis, inferential statistics such as t-tests can help identify significant differences between groups.
Create your Likert-based survey, form, or poll now!
In summary, Likert scales work by providing a simple yet powerful way to collect and analyze data on people’s attitudes and opinions. By carefully designing your Likert scale questions and choosing the right response options, you can gather accurate results and gain valuable insights for your next survey—whether you’re conducting market research, evaluating customer satisfaction, or exploring trends in medical education.
Are Likert Scales Ordinal or Interval?
Almost everyone agrees that the Likert rating scale provides ordinal data (data that is measured along a scale, but the distances between each point are unknown). However, many believe this scale also provides interval data (data that is measured along a scale, with each point placed at equal distances from one another).
Here’s what we think: Likert survey scales provide ordinal data, as the results naturally represent someone’s preferences. For example, we know that a 4 is better than a 3. However, it’s not interval data because we don’t know exactly what constitutes a 4 versus a 3 in someone’s mind.
Create your Likert-based survey, form, or poll now!
That said, when a survey has enough questions, many researchers use the data to come up with reliable averages. This means Likert scales “approach” the definition of interval data. Researchers often summarize Likert scale data using measures of central tendency, such as the median or mode, to understand the distribution of responses better.
We think Dr. David L. Morgan from Portland State University’s Sociology Department summed up the interval nature of the scale well. He says, “The key point here is to use multiple items, where any one of them may be too weak to provide an adequate measure, but the combination of them is much stronger.” By combining responses from multiple Likert items, researchers can calculate a total score for each participant, which provides a comprehensive measure for further statistical analysis.
Are Likert Scales Quantitative or Qualitative?
Likert scales give quantitative value to qualitative data. For example, it may be designed to measure how much a person agrees with a statement regarding a product’s value and assign a data point to it. This is one reason why the scale is almost universally loved. Researchers appreciate that Likert rating scale questions use a universal method of collecting data, so the results can be easily understood. Additionally, CEOs and marketers like that they can say someone thinks their product is “excellent” because they assigned a “10” to it. However, the meaning of each response can be influenced by the respondent’s subjective interpretation of the scale points.
Create your Likert-based survey, form, or poll now!
Why Use a Likert Scale? Advantages and Disadvantages
There are Likert scale advantages and disadvantages. However, there are many more pros than cons!
Likert scales are easy for people to understand and complete. Because questions using the Likert method follow a scale, respondents don’t have to answer yes or no, or either-or. Instead, they can choose to be neutral. All of this means that they wind up delivering better response rates! In addition, questions are easier to analyze and report on than open-ended or fill-in-the-blank questions, which are more difficult to analyze because the answers haven’t been configured in advance. Likert scales also make it easier to interpret and compare survey responses across different groups or questions, helping you identify trends and satisfaction levels more effectively.
The one drawback is that you don’t always get in-depth feedback. Consider a restaurant. Sure, you may know someone is dissatisfied with your restaurant because they only gave you one star. But, you won’t know why they were dissatisfied (Was it the food quality? The service? Cleanliness?). To solve this, it’s important to ask multiple questions about different aspects of the customer’s visit. After that, ask for their overall satisfaction level.
Difference Between a 5 Point Likert Scale and a 7 Point Scale
Most researchers agree that the best Likert scales are the 5-point and 7-point varieties. This simply refers to how many responses the person has to choose from. Five point scales are especially popular for their simplicity and effectiveness in capturing a range of opinions without overwhelming respondents. Most Likert scales you see are going to be odd-numbered. They will have an equal number of positive and negative responses on either side of a neutral response. Poor to excellent Likert scales are popular, as you’ll see in one of our 5-point Likert scale templates below.
Create your Likert-based survey, form, or poll now!
So why are 5-point and 7-point scales considered ideal? Because if you offer fewer than five options, online survey takers may be limited in their responses; they may resort to picking the “most” applicable answer. As a result, you’re deprived of their true opinion. The seven-point scale, in particular, provides a broader range of responses, allowing for more nuanced measurement of attitudes or feelings. On the other hand, if you go above seven, respondents may feel overwhelmed or annoyed; they may just pick a random answer to move along quickly.
Choosing the right survey scale is essential for collecting accurate and meaningful data from your respondents.
Other Point Variations in Likert Scales
While the 5-point and 7-point Likert scales are the most popular, there are other variations. The choice of scale variation can also influence how results are visualized, such as displaying response distributions in a bar chart.
2-Point Likert Scale
The simplest form of this scale provides no neutral option (yes/no).
Create your Likert-based survey, form, or poll now!
3-Point Likert Scale
The 3-point scale is used similarly to the 2-point version, but introduces a neutral option (yes/unsure/no).
4-Point Likert Scale
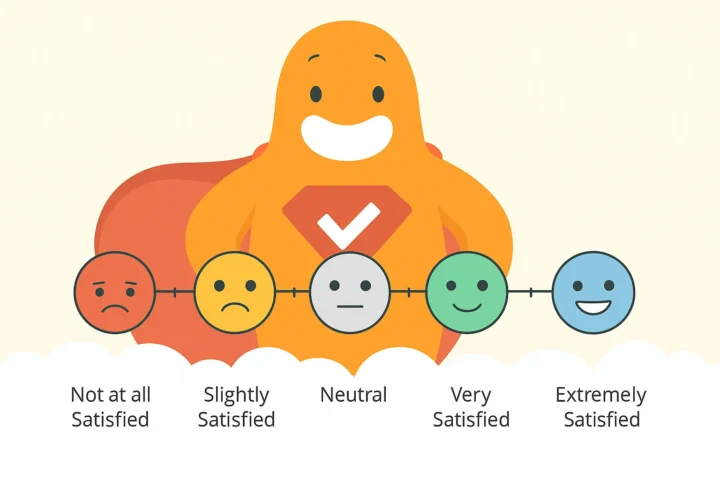
This version forces respondents to make a choice. Consider this 4-point smiley face Likert scale, where the faces represent: Extremely Dissatisfied, Somewhat Dissatisfied, Satisfied, and Extremely Satisfied:

Create your Likert-based survey, form, or poll now!
5-Point Likert Scale
A 5-point Likert scale helps measure opinions clearly, offering a simple range from positive to negative. Example: Very Satisfied, Satisfied, Neutral, Dissatisfied, Very Dissatisfied. Widely used in surveys to gather reliable feedback and trusted by researchers.
6-Point Likert Scale
The 6-point scale is meant to provide more options for respondents. Because it is an even point scale, there is no neutral option.
Create your Likert-based survey, form, or poll now!
7-Point Likert Scale
A 7-point Likert scale offers a more detailed way to measure attitudes and opinions, giving respondents greater precision. Example: Very Satisfied, Satisfied, Somewhat Satisfied, Neutral, Somewhat Dissatisfied, Dissatisfied, Very Dissatisfied. Ideal for capturing nuanced feedback in surveys.
9-Point Likert Scale
This Likert scale is used to offer respondents a wider variety of choices. Additionally, it provides a higher degree of measurement precision, with a neutral option. However, it’s not commonly used as it can take respondents longer to make their selections, which can result in less accurate responses as participants speed through the survey.
Create your Likert-based survey, form, or poll now!
10-Point Likert Scale
This provides a greater Likert scale level of measurement precision, like the 9-point Likert scale. However, it does not include a neutral option.
Understanding Likert Scale Responses
Likert scale responses are at the heart of effective survey research, offering a structured way to capture how people feel about a particular topic. When you use a Likert scale—a popular type of rating scale—you present survey respondents with a statement and a set of response options that typically range from “strongly disagree” to “strongly agree.” This approach allows participants to express varying degrees of agreement or disagreement, rather than being limited to a simple yes or no.
The strength of Likert scale responses lies in their ability to transform subjective attitudes into measurable data. Each response option on the scale represents a specific point of view, making it easier to identify patterns and trends in how people think or feel. For example, a classic 5-point Likert scale might include: strongly disagree, somewhat disagree, neither agree nor disagree, somewhat agree, and strongly agree. These clearly defined response options help ensure that survey data is both reliable and easy to interpret.
Create your Likert-based survey, form, or poll now!
In survey research, the way respondents choose their answers on a Likert scale provides valuable insights into customer satisfaction, employee engagement, or public opinion. By analyzing the distribution of Likert scale responses, researchers can better understand the intensity of people’s attitudes and identify areas for improvement or further investigation.
Ultimately, understanding Likert scale responses is essential for anyone looking to collect meaningful data and make informed decisions based on people’s real opinions. Whether you’re measuring customer loyalty, evaluating a new product, or tracking changes in public sentiment, a well-designed Likert scale can help you gather the actionable insights you need.
Create your Likert-based survey, form, or poll now!
5 Tips for Creating a Likert Scale
1. Ask multiple questions
It’s often not enough to ask one general question about a particular topic, opinion, or experience. If you do, you won’t see the full picture. Asking multiple questions remedies this, taking into consideration all of the factors that could have contributed to this response.
2. Avoid using different scales
Mixing different scales within your surveys can cause respondent confusion. Bonus: Using only one scale will also make your final analysis that much easier.
Create your Likert-based survey, form, or poll now!
3. Label the numeric responses
Do not simply attach a number to possible responses. Always include wording on your scale question; otherwise, online survey takers may confuse which numbers are positive and which are negative.
4. Create unbiased responses
To improve Likert scale validity and reliability, stay away from survey questions that may lead people to answer a certain way. For example, you don’t want to force them to choose between extremes, as it can skew your results.
Create your Likert-based survey, form, or poll now!
5. Keep it simple
Creating a Likert scale survey doesn’t need to be complicated. In fact, the best survey questions are concise and to the point. For example, long, complex questions tend to lose readers or test their patience. Additionally, inadvertently asking two questions in one can leave respondents unsure of how to answer.
Likert Scale Examples and Questions
Below are a number of examples of Likert scales using different numbers of points that may provide inspiration when developing your survey. Likert scales are commonly used to measure people’s attitudes toward various topics, helping researchers understand opinions, agreement levels, and feelings.
Likert scales are also widely used in clinical psychology research to assess attitudes, symptoms, or treatment outcomes.
However, please note that the numbers in the answers indicate the relative position of items, but not the magnitude of the difference. Additionally, you do not have to include numbers in your survey questions if you prefer not to.
After collecting responses, Likert scale responses can be analyzed to gain insights into group opinions and trends within your survey data.
 Comparing 2 Products
 Quality
 Support / Opposition
 Barriers
 Likelihood
 Good / Bad
 Reflect Me
 My Beliefs
 Familiarity Level
 Awareness Level
 Knowledge of Action
 Affect on …
 Acceptability Level
 Appropriateness Level
 Importance Level
 Concern Level
 Difficulty Level
 Influence Level
 Probability Level
 Overall Impression
 Agreement Level
Level of Agreement
 Satisfaction Level
Level of Satisfaction
 Frequency
How Often?
How to Analyze Likert Scale Data
You will find many ideas out there about how to analyze Likert scale data. For example, many people want to know how to calculate the mean score for Likert scale data, which would simply be the sum of all numbers divided by the count. However, as mentioned earlier, these scales provide ordinal data, and the values between points cannot be considered equal. Therefore, using a mean (the average of all the numbers) is not appropriate for analysis. When analyzing data from Likert scales, it is important to use appropriate statistical methods, such as descriptive statistics like the mode or median for ordinal data, and consider inferential statistics like chi-square tests or Spearman’s correlation when applicable.
Create your Likert-based survey, form, or poll now!
Instead, it is recommended that you use a mode score for appropriate analysis of ordinal data. First, to calculate the mode score for Likert scale data, simply determine the number that appears the most. So, let’s say you surveyed ten people on the quality of a product on a 5-point scale and the results were as follows:
5, 5, 4, 1, 4, 4, 4, 4, 4, 3
In this example, the mode would be 4, as it appears the most. You’ll note that in this example, the mean would also have been 4. However, in highly skewed distributions, these numbers would be different, as you’ll see below:
1, 1, 1, 1, 5, 5, 5, 1, 1, 1
Here, the mode would be 1. Most people clearly don’t like the product. However, the mean would have been 3, but concluding that most people think the product is average is clearly not the case, which is why a mode score is most appropriate when analyzing Likert scale data.
For more information on Likert scale analysis and statistical methods, you can refer to resources like Simply Psychology, which provides accessible explanations and guidance.
Create your Likert-based survey, form, or poll now!
Live Likert Scale Example
Want to see a Likert scale in action? Below is a Likert scale example created using SurveyLegend’s opinion scale option. Go ahead and try it for yourself, it’s live!
Conclusion
A Likert scale is a great option for businesses and researchers wanting an easy way to survey customers or the general public. When it’s time to create your survey, choose SurveyLegend for easy design and analysis. SurveyLegend offers the best online survey software, with countless survey samples and templates. So, do you want to switch languages to have your Likert scale in Spanish or another language? We let you easily create Likert scale questions that are responsive, beautifully adjusting even to the small mobile phone screens.
Have you used a Likert scale in your research? Did you find it easy to use and analyze? Let us know in the comments!
Frequently Asked Questions (FAQs)
Is the Likert scale capitalized?
Yes. It’s named after American social scientist Rensis Likert, who created the scale.
What is a Likert scale?
A Likert scales measure how much a person agrees with a statement, providing five or seven balanced responses that people can choose from with a neutral midpoint.
Are Likert scales ordinal or interval?
A Likert scale provides ordinal data (data that is measured along a scale, but the distances between each point are unknown).
Is a Likert Scale Quantitative or Qualitative?
Likert scales give quantitative value to qualitative data, assigning a data point to a statement.
Should you use a mean or a mode to analyze Likert scale data?
A mode score should be used to determine which number appears the most.