

U.S. Demographics Survey Template
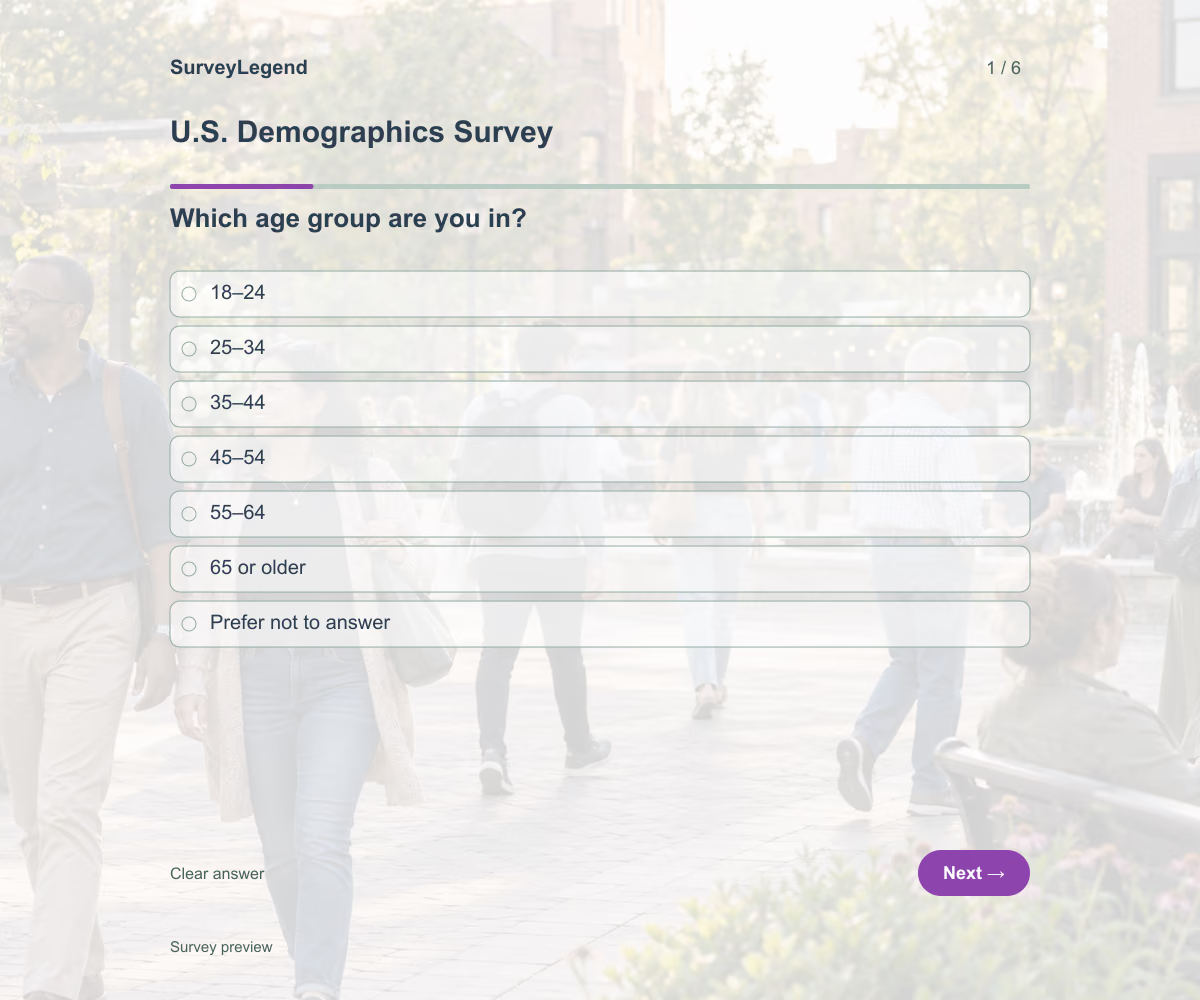
This U.S. demographics survey template helps you describe the adults who respond to your research. Its six optional questions cover age, location, education, work, household size, and household income. Choose the characteristics that serve your research question, then create your questionnaire with SurveyLegend.
Choose Demographic Questions for a Specific Decision
Use this example when you need context about the people answering a customer, audience, or market research survey. Decide how each characteristic will be used before collecting it. If you will not use household income to answer the research question, remove that item.
This version is designed for adults in the United States. It is an original audience questionnaire, not an official Census form or a nationally representative study.
6 Optional U.S. Demographic Questions
The example uses age bands, a state or territory field, education categories, employment status, household size, and income bands in U.S. dollars. Every question can be skipped. Keep “Prefer not to answer” separate from substantive responses when reviewing the results.
Household income is defined as the combined income of household members before taxes during the previous calendar year. Keep that definition visible so respondents are answering the same question.
A little feedback. A clearer picture.
Explore this 6-question example at your own pace. Every question is optional.

U.S. Demographics Survey
Thank you for trying the survey!
You’ve tried the template from the respondent’s side. Make it your own with SurveyLegend.
Create your own surveyChecking submission availability…
This is a demo. We count starts and submissions only. Your answers stay in your browser and are never sent or saved.
Activity · no starts yet
Match the Categories to Your Audience
Use adult age bands that fit your intended comparisons without creating tiny groups. A state or territory field can provide useful geographic context without asking for a street address. Replace the free-text field with your verified list of locations if consistent categories are needed.
Education and employment choices should fit the audience you are surveying. If your research requires comparison with an external dataset, match its definitions, response categories, reference period, and population before making that comparison. Do not assume similarly named variables mean the same thing.
Choose questions by the comparison you need. For example, a local adult-learning survey might need age band and education but have no use for household income. Remove the income item in that case. This is a short respondent-profile questionnaire; it does not include every demographic characteristic or reproduce a federal instrument. If race, ethnicity, gender, or another characteristic is essential to your research, define its purpose and review suitable wording and categories before adding it.
Printable U.S. demographics survey template
Use this printable U.S. demographics survey template to collect answers from people who prefer paper or are less comfortable with online forms. Offer adults a paper questionnaire when collecting respondent information in person or when they prefer to answer offline.
Download the PDF, print the 6-question questionnaire, and provide copies for people to complete by hand. It includes the same core questions as the online template, with space for written answers.
Online or on paper, SurveyLegend helps you give your audience a way to respond that works for them.
 Download PDF
 AI prompt for a U.S. demographics survey
Create a U.S. demographics survey in SurveyLegend with questions about age, location, education, employment, household size, and income.
This prompt includes six questions and their answer choices. Register for a free account to use it in SurveyLegend, then review and customize your survey before sharing it.
Create a free account, then paste the copied prompt into SurveyLegend.
Already have an account? Sign in to create your U.S. demographics survey.
Describe Respondents Without Overstating the Findings
Count valid answers separately for each question because optional items can have different response totals. Report skipped answers and “Prefer not to answer” separately. For example, the share in an age band should use the people who provided an age-band answer as its denominator, with that basis clearly stated.
Your results describe the people who responded. They do not automatically describe all U.S. adults or all of your customers. Check who was invited and who participated before making wider claims. Avoid reporting combinations of characteristics that could single out an individual.
For example, suppose 80 people complete the survey, 60 provide an age band, and 18 of those select ages 35–44. Report 30% of respondents who answered the age question, alongside the 60-answer base and the 20 who did not provide an age band. Do not describe that as 30% of all survey participants.
Frequently asked questions
Do I need to include every demographic question?
No. Include only the characteristics needed for your research. Asking fewer relevant questions can make the purpose easier to explain and reduce the amount of personal information you need to manage.
Does this template use official Census categories?
No. The questions are an editable starting point for an adult audience study. If you need an official comparison, use the relevant dataset's exact definitions and check that your collection method supports the intended analysis.
Is this the right template for a local community survey?
Choose the questionnaire by the decision you need to make. This example describes a research audience. Our citizen demographic survey template is the related starting point for understanding a local community.
-
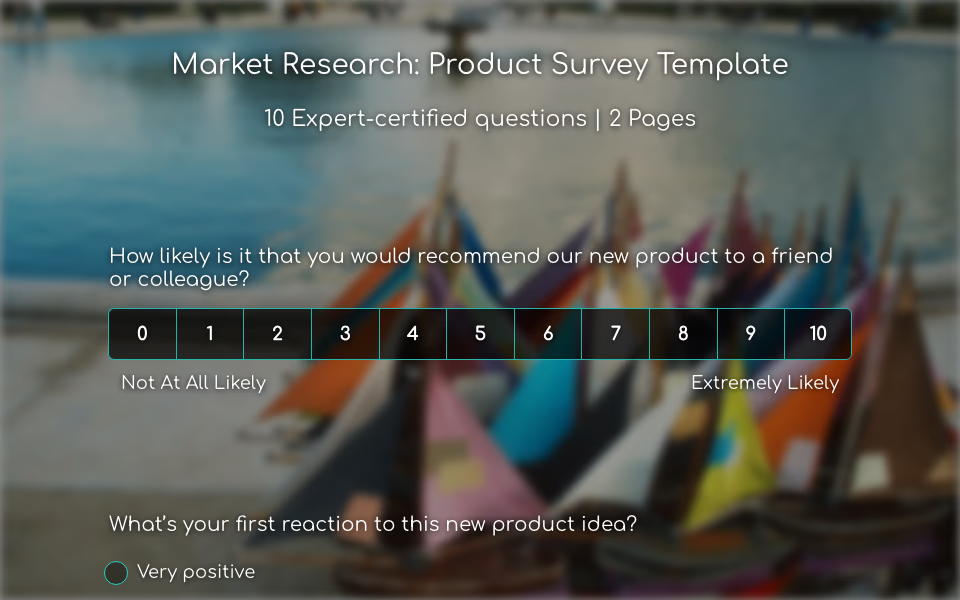 Product Survey Template Every time a new product is going to be launched on the market, the producers should make sure that it is going to be well-received by the consumers who are going to use it. Therefore, doing fundamental pre-launch market research is always an inevitable must. Analyzing the survey data collected during this research can provide actionable feedback and actionable insights that guide product development and enhance customer satisfaction.
 -
 New Service Survey Template Thinking of launching a new product or service? Asking your audience what they think before you roll it out is one of the smartest moves you can make, especially if you can hear directly from your most loyal customers. It is something every company should do before bringing a brand-new service to the market.
 -
 Target Market Analysis Survey Template Every smart marketing consultant needs the right tools to dive deep into a client’s target market—and that starts with asking the right questions. Whether you are offering professional services to others or trying to understand your audience, you need reliable insights to shape strategy.
 -
 Brand Awareness Survey Template These days, we live in a global economy. People scroll through international news, wear clothes made on different continents, and dine on dishes from all over the world. It’s exciting, but it also ramps up the pressure on brands. With fierce competition, having a strong presence through a brand perception survey is more important than ever. It helps ensure your business stays relevant—not just now, but well into the next decade, whether you’re focused on local reach or global growth.
Free survey maker
Start creating surveys today for free
Create and bring your ideas to life with the survey tool used by people all over the world.
Ready to collect better research data?
Create academic surveys and questionnaires from ready-made templates.