Picture ranking
Picture ranking is a variation of our Picture selectionquestion types, which offers “ranking” possibility, instead of conventional methods of choice selection (Single selection, and Multiple selection). This feature allows your respondents to rank their favorite pictures, which are presented in a nice gallery layout.
In this article:
Intro | Uploading many images at once | Uploading large image files | How rank is calculated | Settings | Voting type | Layout
![]()
Picture ranking makes it super easy to ask questions using images as choices. You can upload several pictures and even choose a beautiful layout to present them in a visually applealing way to survey respondents. They will be able to click or tap on the images to rank them in the order they want.
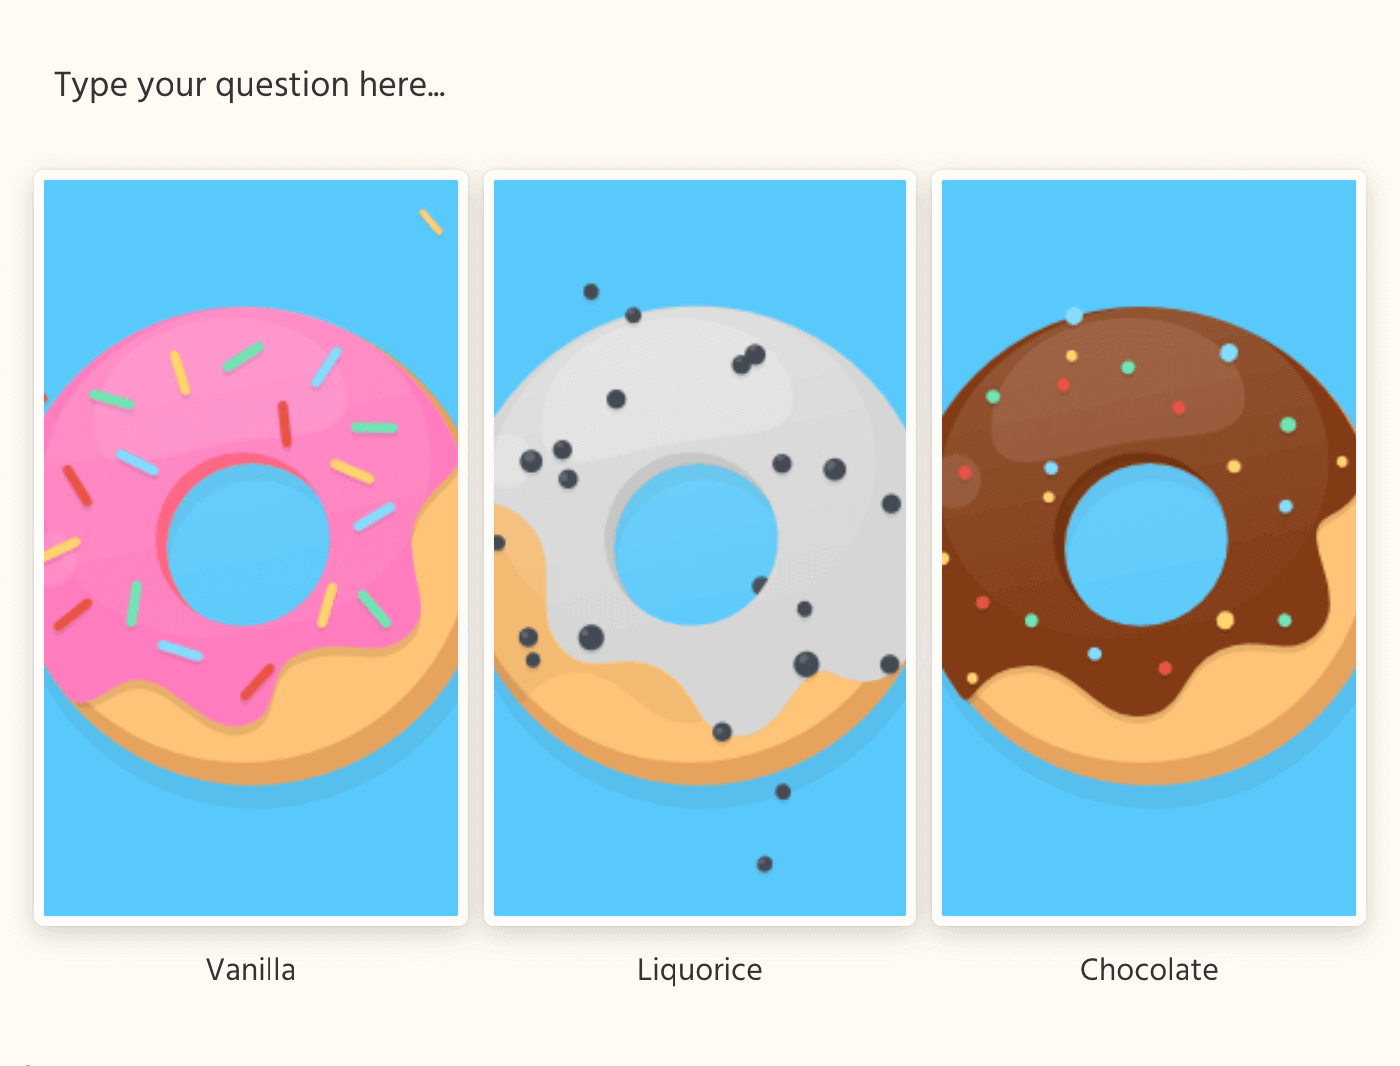
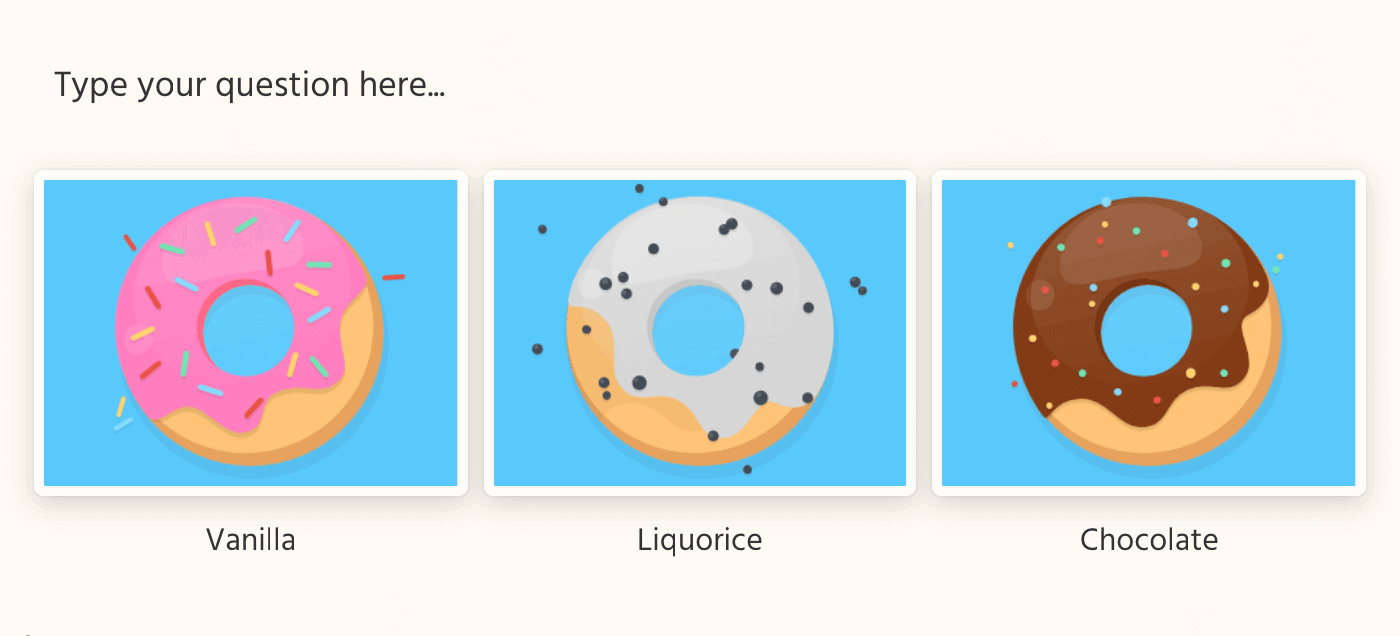
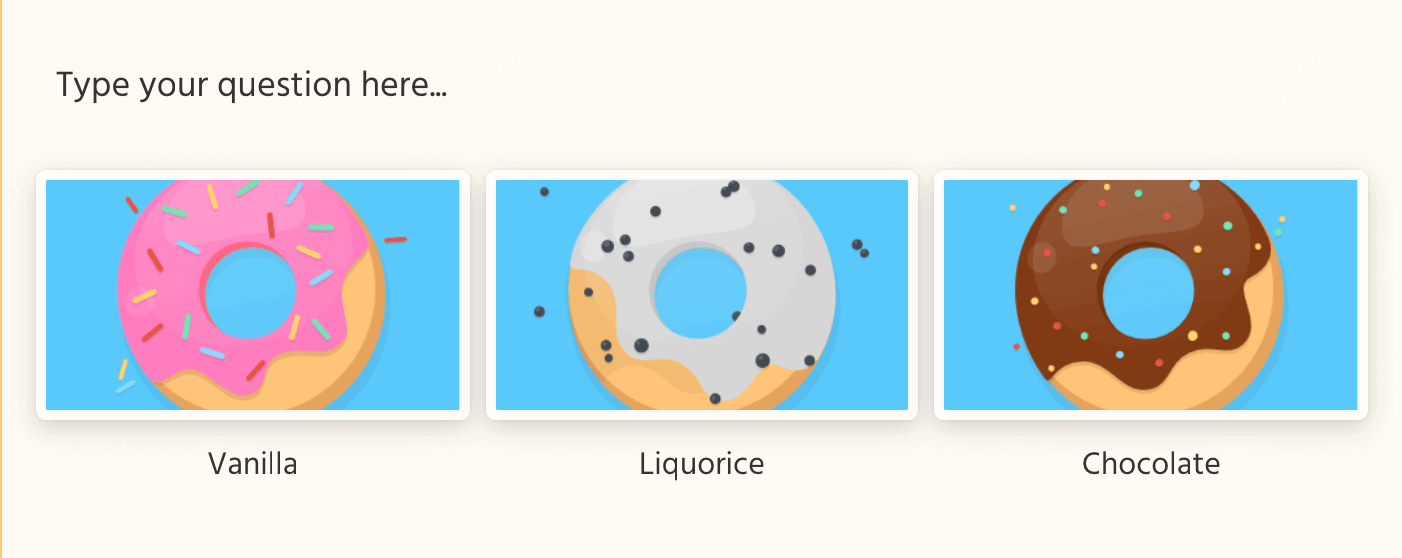
When you drag a Picture ranking question type into your survey, you will see a sample question, along with three images. This is to show you how such a question would look in a real online survey. However, as soon as you click on the question type to edit it, you’ll notice that the preview image choices disappear and an Upload button takes their place.
Now, go ahead and click on the upload button ![]() to add images to your question. The great thing is that you can easily add several images at once, and let the system take care of uploading all of them for you.
to add images to your question. The great thing is that you can easily add several images at once, and let the system take care of uploading all of them for you.
Uploading many images at once
It is very easy to upload multiple image-files at once. Just select them all, then drag & drop them on the upload area, or click the upload button and then select all your pictures. Our system will now handle all files and uploads them into your survey.
However, please be patient and stay in “Create” step, until all files are uploaded! Don’t go to other steps (e.g. Design, Share) before all images are uploaded, and the upload progressbars have disappeared.
Note that our survey editor might still show thumbnails of the images perfectly fine, when you are viewing the survey, even if the image-files are not 100% uploaded. But don’t forget that those are just thumbnails, not the actual full-size image files. Make sure that you have all images uploaded by previwing your survey.
If there are incomplete uploads in your Picture ranking questions, survey participants might not be able to select choices. In this case, the data collection may be negatively affected.
Uploading large image files
If you have several large-sized images, you don’t need to bother resizing them before upload. Our smart system will automatically shrink the image to a suitable size, before upload starts. This saves you a lot of bandwidth and precious time. Your original images will, of course, remain untouched on your local disk.
How the rank is calculated
Depending on the order participants vote on items in the Picture Ranking question, we allocate a number to the selected item. Therefore the first picture they click on will get number one (1), second vote will be two (2), third vote will be (3) and so on.
Weighted rank
Our system calculates rank of each based on the following method, which we call “Weighted Ranking”. Based on Weighted Ranking method, each item gets a weight, or degree of importance. An overall score is calculated for each item, and then in the Live Analytics view, the choices are displayed in descending order based on their overall score. The top-scoring option is the best choice and is on top.
So, this is how “Weighted Rank” is calculated: Weighted Rank = Weight * Total Votes Received.
Note that in the above formula, weights has to be applied in reverse order! It means the respondent’s most favorite choice which they rank as #1, has actually the largest weight. Also naturally their least preferred choice (or the last thing they rank) needs to a weight of 1.
For example, if a if they have to rank their top 5 choices, weights need to be assigned as follows:
The #1 choice has a weight of 5
The #2 choice has a weight of 4
The #3 choice has a weight of 3
The #4 choice has a weight of 2
The #5 choice has a weight of 1
Now every time an item gets selected by a respondent, it gets a score. The score is calcualted based on what weight the item gets each time it is picked. If an item gets ranked as top 1 out of five, it gets a weight of 5, and therefore a score of 5. Next time someone picks the same item, but as top 2 (out of 5), but this time the weight will be 4, and the totall score that this item has gotten will be 5 + 4 = 9. This score gets higher and higher, every time a person selects the same choice and gives it a rank (or a weight).
Average
However, when you look at the results in Live Analytics, along with the “score” for each item you will also see the “average” number that each item has received through the voting process.
The average is calculated based on the actual rank that the item has recieved each time, divided by the total number of times the item has been chosen.
For example, you ask respondents to rank their top 3 pictures, and you get 4 responses in total. One of the pictures has been chose 3 times as first rank, and1 time as second rank. Therefore the average number will be 1.25 → ( 1 + 1 + 1 + 2 = 5 ) divided by 4 (which is the total number of times that this spesific items has been chosen.
The average for each item is there to show you that a certain group of people like that spesific item; and in average this group who like that item vote for it in a certain way. Maybe this group who like this spesific item are not many at all, therefore that item never gets a high score and will never end up at the top of the list. However, perhaps in average, those people who pick that item really like it a lot and always rank it as their number 1 choices for example. This is something that you can see from the average only, not from the total score.
![]()
When you have added a Picture ranking question to your survey, click or tap on it to activate the “Edit Mode” and access the settings panel.
You can easily customise the Picture ranking, to ask the type of question intended for your surveys. Picture ranking offers the following customization possibilities:
Answer is required 
Enable picture for question
Instructions for respondents
Hide choice text for respondents
Randomize order of choices
Zoomable pictures
Voting type
Number of choices per row

By enabling this settings, you will demand the respondents to answer this question. So when this setting is ON, we notify the respondents with a visual clue, that they cannot continue to next page or submit the survey, before answering the question, which in this case is selecting one or more pictures.
Read more about when you ‘should’ or ‘should not’ make answering compulsory in your online questionnaires.
Add redirect link for picture
Enabling this setting will allow you to add a large, edge-to-edge image right under the question. If your question needs further explanation using a picture or illustration, you can easily upload it here. Read more about best practices of adding pictures to survey questions.
Additionally, you can add a custom link to the picture after you upload one. Linked images can act as banners, helping you promote something or add incentives for your respondents to finish a survey. They can also help you create download links, or lead users to other pages or your other surveys. Read more about adding links pictures in your survey.
Always visible instructions
Sometimes you may need to explain further, or add tips or instructions for your respondents. Enabling this feature will activate an extra text box in which you can type these instructions. By default, these additional instructions appear as a little button with a question mark inside them, right under the question text. When clicked, they expand and show your additional text.
Instead, if you prefer to constantly display this text, please activate “Always visible instructions” option. This will directly display the additional instructions under the question, and respondents do not have to manually click on it to display it. Read more about adding further instructions or tips for survey questions.
Whenever needed, you can easily hide the choice text which was displayed under each picture. This helps you clean up the interface, and remove any unwanted effects that text-labels may have on how people respond to your question.
However, hidden choice texts will be visible for you when creating the survey, and also in your Live Analytics and in the exported data. Therefore it is a good idea to type some titles and make it easier for yourself to analyze the data. If you don’t type anything, our system will automatically use digits (1, 2, 3) to indicate the choices in exported data which may be hard for you to identify when looking at the data.
Enabling this randomizes the order choices appear each time the survey is loaded for each respondent. This can be used to avoid order-bias, which can happen sometimes when some respondents disappointingly choose the first or last choices from a list, because those are very easy to spot.
Make sure to read more about randomizing order of choices, and learn when & why to use it, or when to avoid it.
Enabling this feature will let the survey participants see a larger version of the pictures that you include in the gallery. This will add a small button with a magnifying glass icon ![]() on each picture. Clicking or tapping on that will open a fullscreen lightbox, in which people can preview all the choices, and even select them.
on each picture. Clicking or tapping on that will open a fullscreen lightbox, in which people can preview all the choices, and even select them.
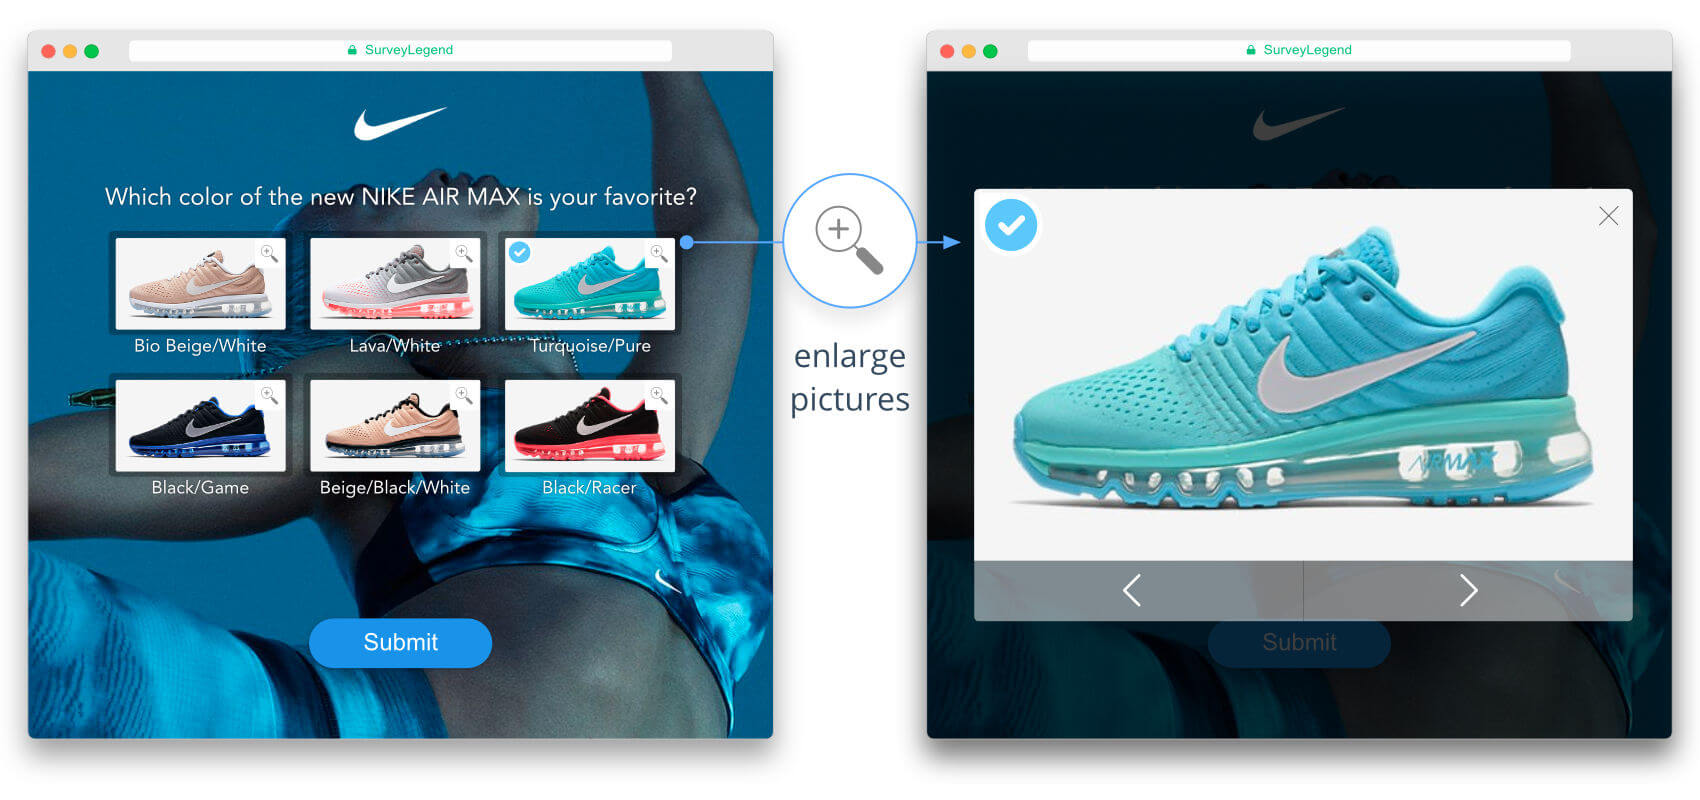
Let respondents see the pictures in high-resolution, to be able to make the best decision!
Enabling this feature is vitual, when you want to collect feedback on pictures with lots of details. This can help respondents to make better decisions.
Different voting types in Picture ranking
As mentioned in the begining of this page, the Picture ranking question is a variation of our Picture selectionquestion types, which offers “ranking” possibility, instead of conventional methods of choice selection (Single selection, and Multiple selection). This question type is generally designed to offers several voting type possibilities, helping you get different types of feedback for picture-based surveys.
So, even though you have chosen the Picture “Ranking” as a question type, you can at any time switch the voting type from Ranking to anything else that suits your survey. You can choose for instance Multiple, Single, Ranked, and or Limited from the voting type dropdown. Each vote type has its own advantages, here are the following advantages and examples of user cases.
Multiple
The respondent can select an unlimited amount of pictures. For example, they can choose 60 out of 100 pictures, or even vote for all 100 pictures presented to them.
By default, respondents are not limited and can select several images per question. However, as a survey creator using Picture selection, you can allow single, multiple, or other types of image selections.
Single
The respondent can vote for only one (1) picture amongst all pictures presented to them. This voting type is great when you want them for example to pick the choice they really like or dislike.
Limited
Choosing this voting type will allow you to limit the number of respondent’s votes. This is a perfect feature if you want the respondent to choose for example “the top five”.
Using the “Require to Choose” slider, you can specify how many choices a respondent ‘has to’ choose (from 1-10).
Note: using this voting type will automatically turn on Answer is required setting.
Ranked
If you want the respondents not only to choose their favorites, but also rank them in the same time, you can use Ranked voting type.
Therefore, when participants vote, we show a different type of indicator on the chosen pictures, which displays their rank. So, the first picture they click on will get number one (1), second vote will be two (2), third vote will be (3) and so on.
If a respondent regrets a choice they can easily remove for example vote number four (4) by clicking on it again, and place the vote on another picture, by choosing it.
Using the “Require to Rank” slider, you can specify how many ranked choices a respondent ‘has to’ choose (from 1-10).
Note: using this voting type will automatically turn on Answer is required setting.
You decide what ranking the respondent has to do choosing from 1-10 with help of the slider appearing beneath the Ranking dropdown named Required rank. Choosing ranking also enables a chart type in Live Analytics shoving you the average vote the pictures have received, it’s only enabled when choosing Ranking as the vote type.
Picture selection’s layout
Our Picture selection question type offers different visual layouts. This empowers you to design your survey as you wish; and make your pictures stand out as they should, by presenting them in the right layout and with the best proportions.
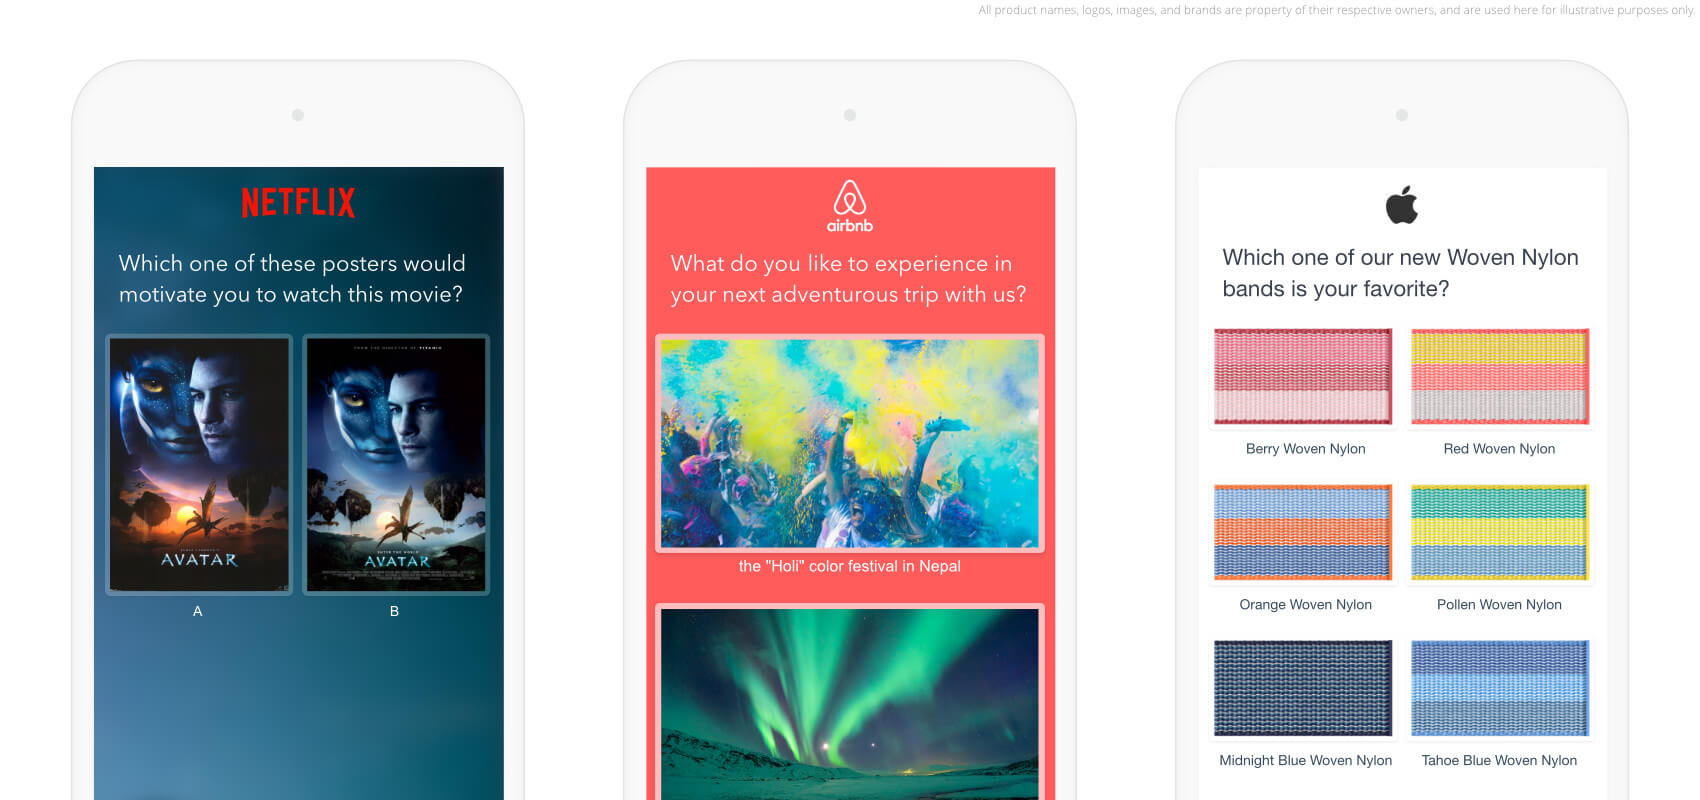
The picture above is for illustrative purposes only.
Number of choices per row
1
1 picture per row
Choosing 1 choice per row means the pictures will occupy the entire width of your survey.
Note that displaying 1 picture per row is not usually a good idea! Because it will cause a lot of scrolling for your respondents, speacially when you choose a tall aspect ratio. Additionally, they may never understand that the choice is “clickable”, and therefore they may need more instructions from you. Think twice when you use this setting!
2
2 pictures per row
Choosing 2 choices per row means the pictures will occupy half of the width of your survey. This layout might be a good one, if you want to make your own binary answers, such as
? | ? , ? | ? , or ? | ❄️ .
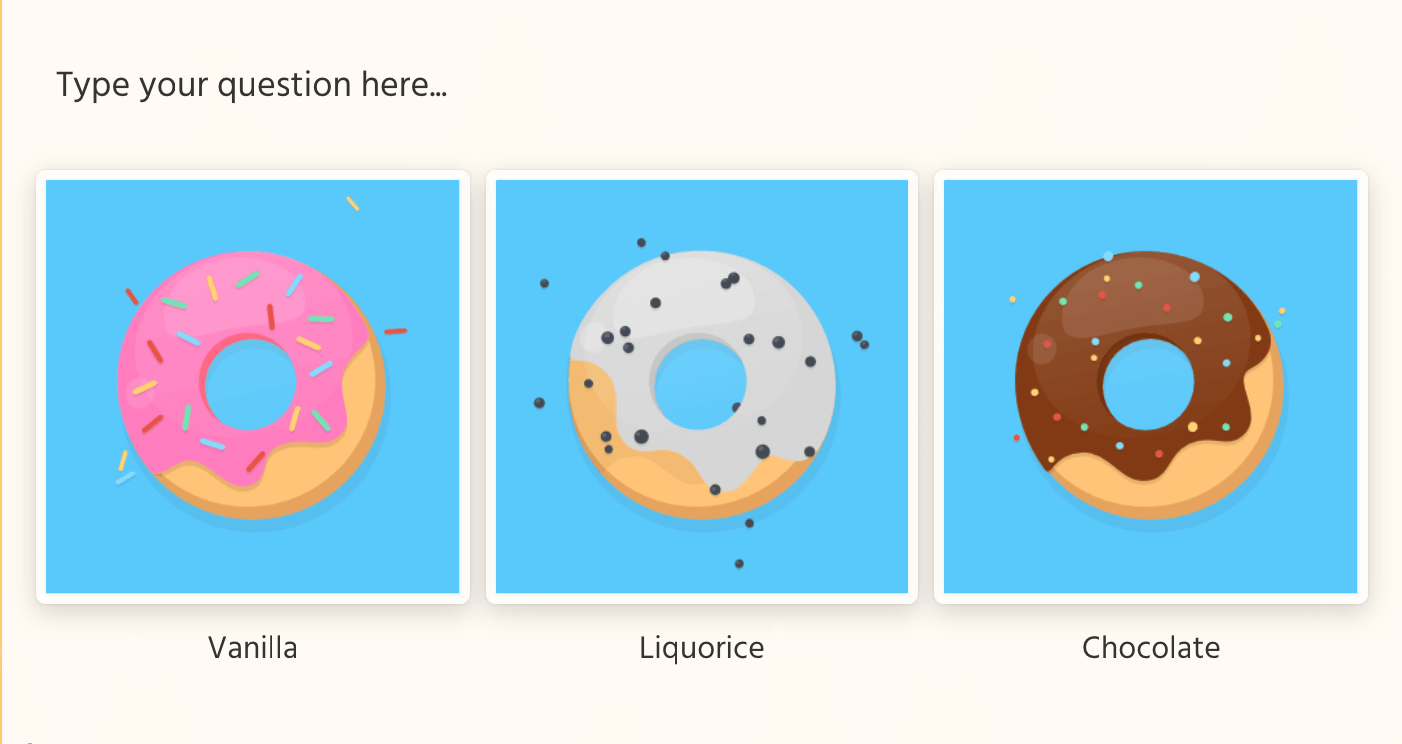
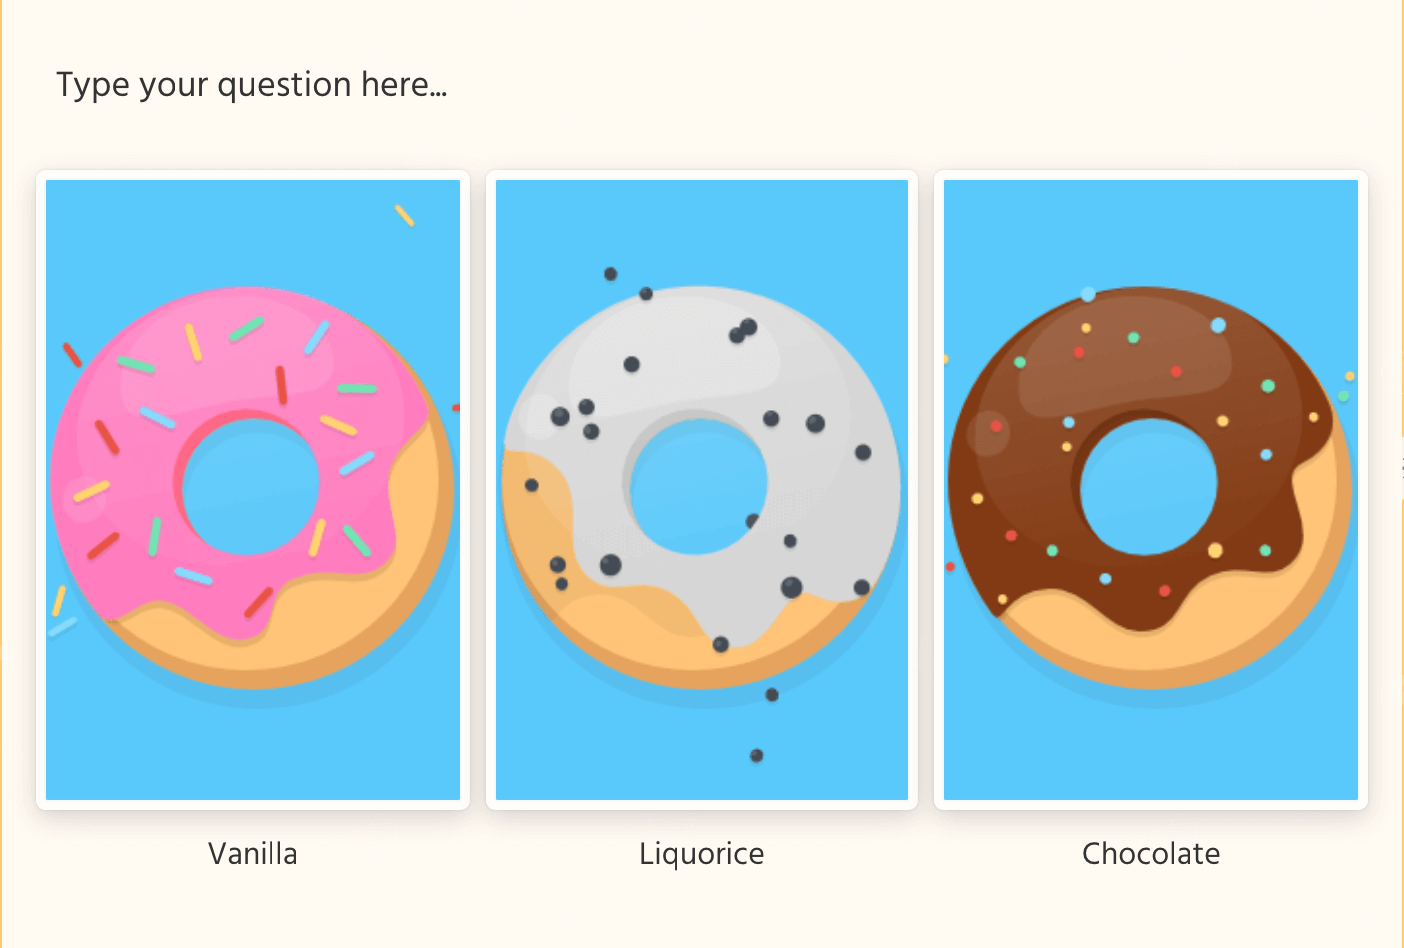
3
3 pictures per row
Choosing 3 choices per row means the pictures will occupy one third of the width of your survey. This layout might be a good one, if you want to make your own trianry and scaled answers, such
? > ? > ? .
4
4 pictures per row
Choosing 4 choices per row means the pictures will occupy one fourth of the width of your survey. This layout might be a good one, if you want to make your own scaled set of answers.
5
5 pictures per row
Choosing 5 choices per row means the pictures will occupy one third of the width of your survey. This layout might be a good one, if you want to make your own scaled answers using images, such as
? > ? > ? > ? > ? .
lock
6 pictures per row
The lock button will remove the responsiveness. It means if you choose 5 choices per row, you will always get 5 choices per row even if the respondent’s screen is too small (for example when they participate on a mobile phone). Activating this feature is a good idea when you’re making questions with scaled answers. For example:
? > ? > ? > ? > ? . In this case, you will want the choices to represent a spectrum of answers, from negative to positive for instance.
Aspect ratio of pictures
1-1
Ratio 1 : 1
This is our default aspect ratio for pictures in the gallery, which means any new Picture selection question that you add to your survey will be set to this aspect ratio.
With this aspect ratio, images are displayed as perfect squares. This means if you have a very wide or very tall image, the system will have to cut off the extra sides of your image to be able to fit it in the preview placeholder. Just keep in mind that only the central part of the image will be visible; as illustrated below.

4-3
Ratio 4:3
In video standards
Image ratio of 4 : 3 for standard television has been in use since the invention of moving picture cameras and many older computer monitors used to display the same aspect ratio.
4:3 was the aspect ratio used for 35 mm silent films back in the days. Since the start of the 21st century broadcasters worldwide are phasing out the 4:3 standard entirely, as manufacturers started to favor the 16:9/16:10 aspect ratio of all modern high-definition television sets, broadcast cameras and computer monitors.
In photography standards
4:3 Is used by most digital point-and-shoot cameras, Four Thirds system, Micro Four Thirds system cameras and medium format 645 cameras. Because this was a popular format, it was used in forst genratios of digital computer monitors.
This format is used as default aspect ratio for all iPhone cameras so far.
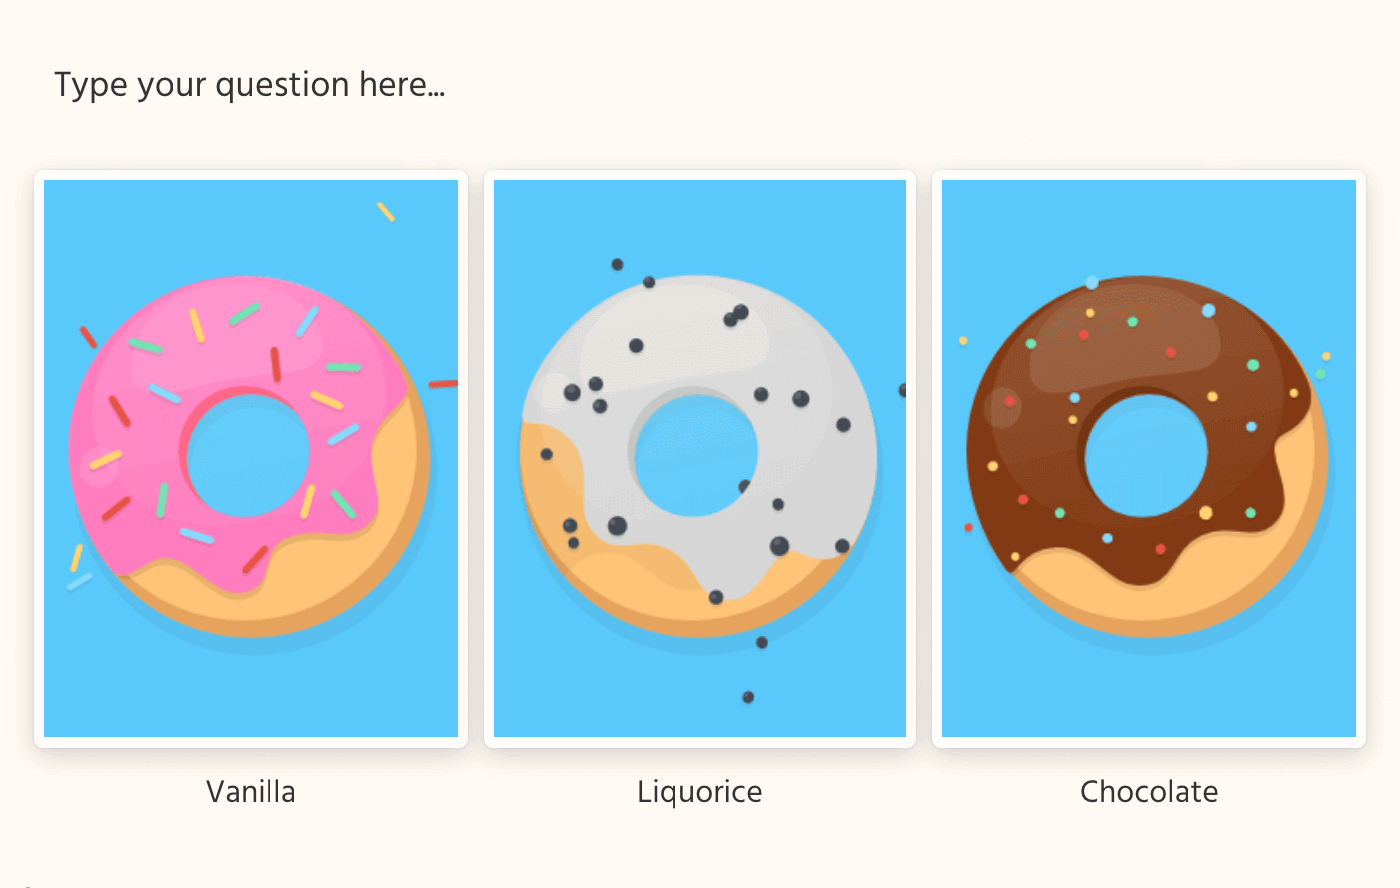
3-4
Ratio 3:4
The 3:4 is usually the format that you get, when you take photos for ID card. Vertical photos taken by iPhone cameras have the 3:4 format by default.
Also check the 4:3 aspect ratio here!
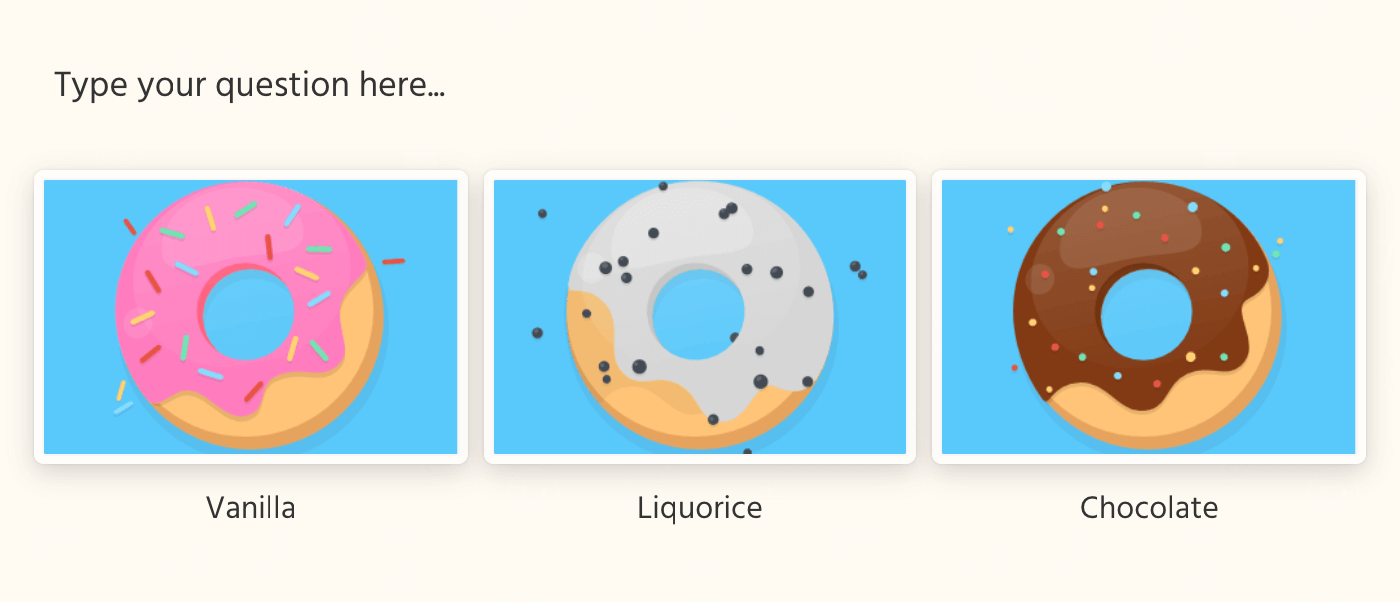
6-4
Ratio 6:4
The 6:4 ratio is one of the standard ratios for horizontal posters, and looks great for landscape photos. This provides you with a perfect layout to display horizontal images in the Picture selection questions.
4-6
Ratio 4:6
The 4:6 ratio is one of the standard ratios for vertical posters. This provides you with a perfect layout to display vertical images such as movie posters in the Picture selection questions.
16-9
Ratio 16:9
The 16 by 9 ratio is one of the standard ratios for wide screen “High Definition” TVs and monitors. The 16:9 ratio is becomming popular as a format in all types of consumer still cameras which also shoot High Definition (HD) video. This provides you with a perfect layout to display horizontal and cinematic images in the Picture selection questions.
9-16
Ratio 9:16
Images with 9:16 ratio may look very tall in a survey, but sometimes this might be just the ratio you’re looking for. This provides you with a perfect layout to display vertical images in the Picture selection questions.